
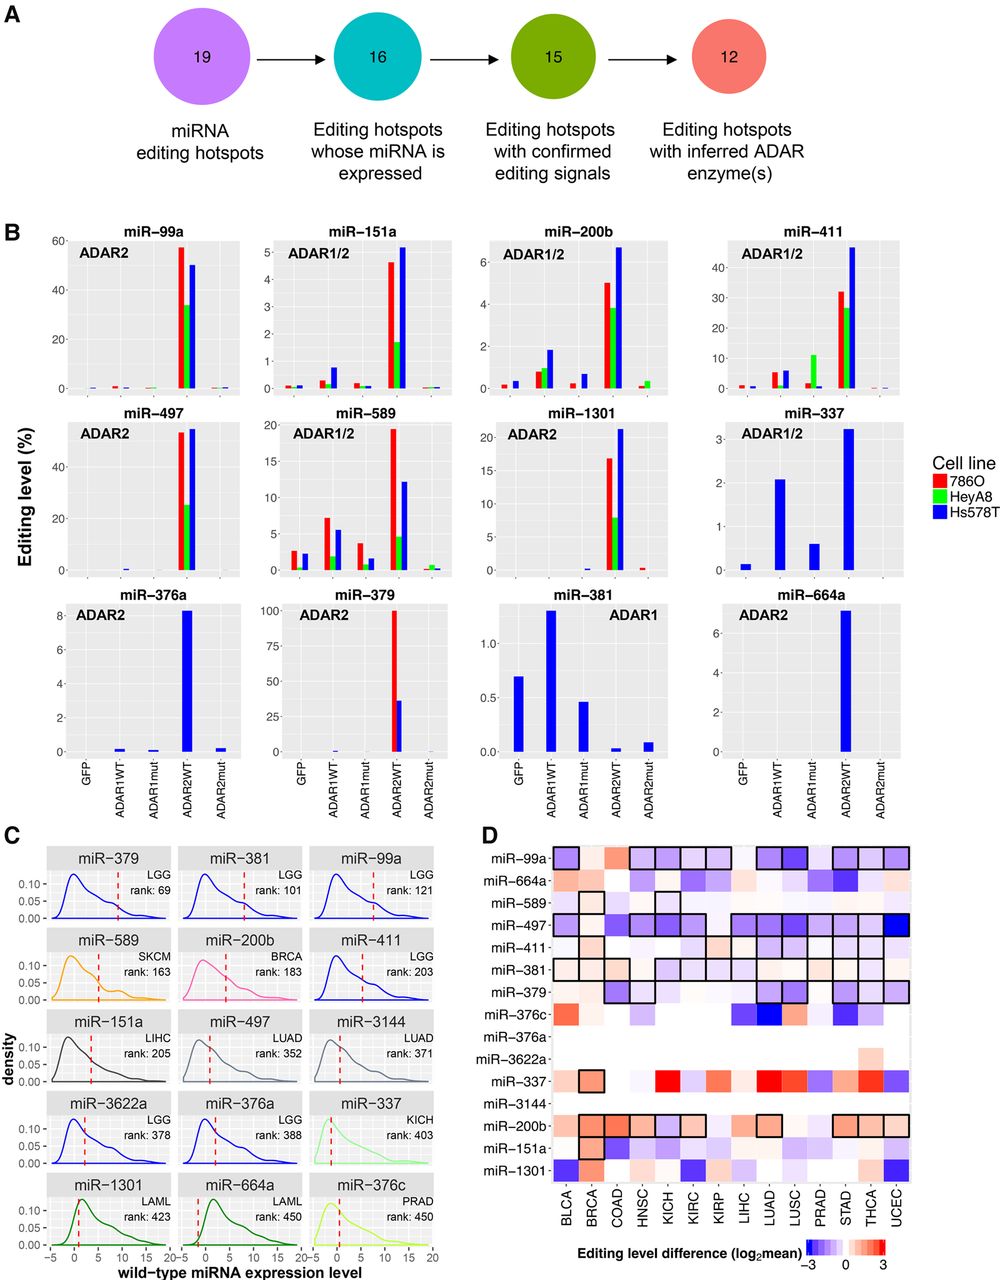
Validation and molecular profiles of cancer miRNA editing hotspots. (A) Numbers of miRNA editing hotspots in the analysis of ADAR-perturbation experiments in 786O, HeyA8, and Hs578T cell lines. (B) The editing level changes after transfection of wild-type ADAR enzymes (ADAR WT), and inactive ADAR enzymes (ADAR mut). Inferred ADAR determinant(s) of each miRNA editing hotspot are shown in each miRNA subpanel. (C) For each edited miRNA, the highest rank of the edited miRNA expression amount (upper-quartile value across samples in a cancer type) relative to the WT miRNA expression amounts (median value) across cancer types is shown. (D) A heat map showing editing-level differences of 19 miRNA editing hotspots between cancerous and matched normal samples (two-sided paired Wilcoxon rank test, n ≥ 5). Red indicates overediting and blue indicates underediting in cancer samples; boxes highlight significant differences (FDR < 0.05).


