
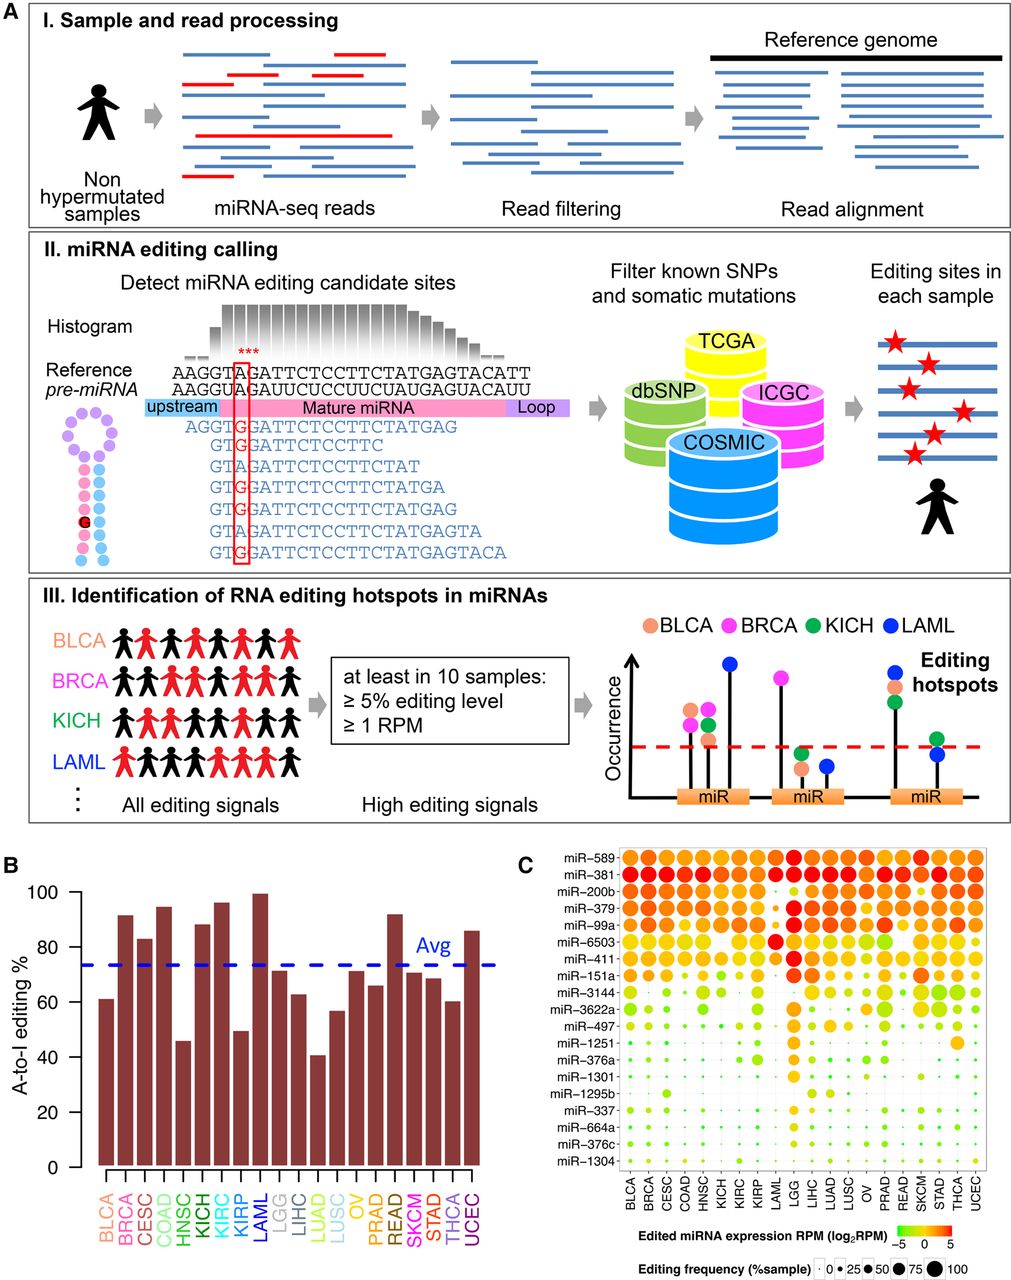
Figure 1.
Overview of bioinformatic pipeline and RNA editing profiles in miRNAs across cancer types. (A) Schematic of bioinformatic pipeline. For each cancer type, sample and read processing, miRNA editing calling (filtering DNA variants using various resources), and identification of miRNA editing hotspots. (B) Proportions of A-to-I RNA editing events among all RNA editing events observed at hotspots in different cancer types; average proportion across 20 cancer types is 73.4%. (C) Heat map of miRNA editing hotspots. Edited miRNA expression amounts (log2RPM) are in color; editing frequencies (% of samples with editing signals) are indicated by circle size.


