
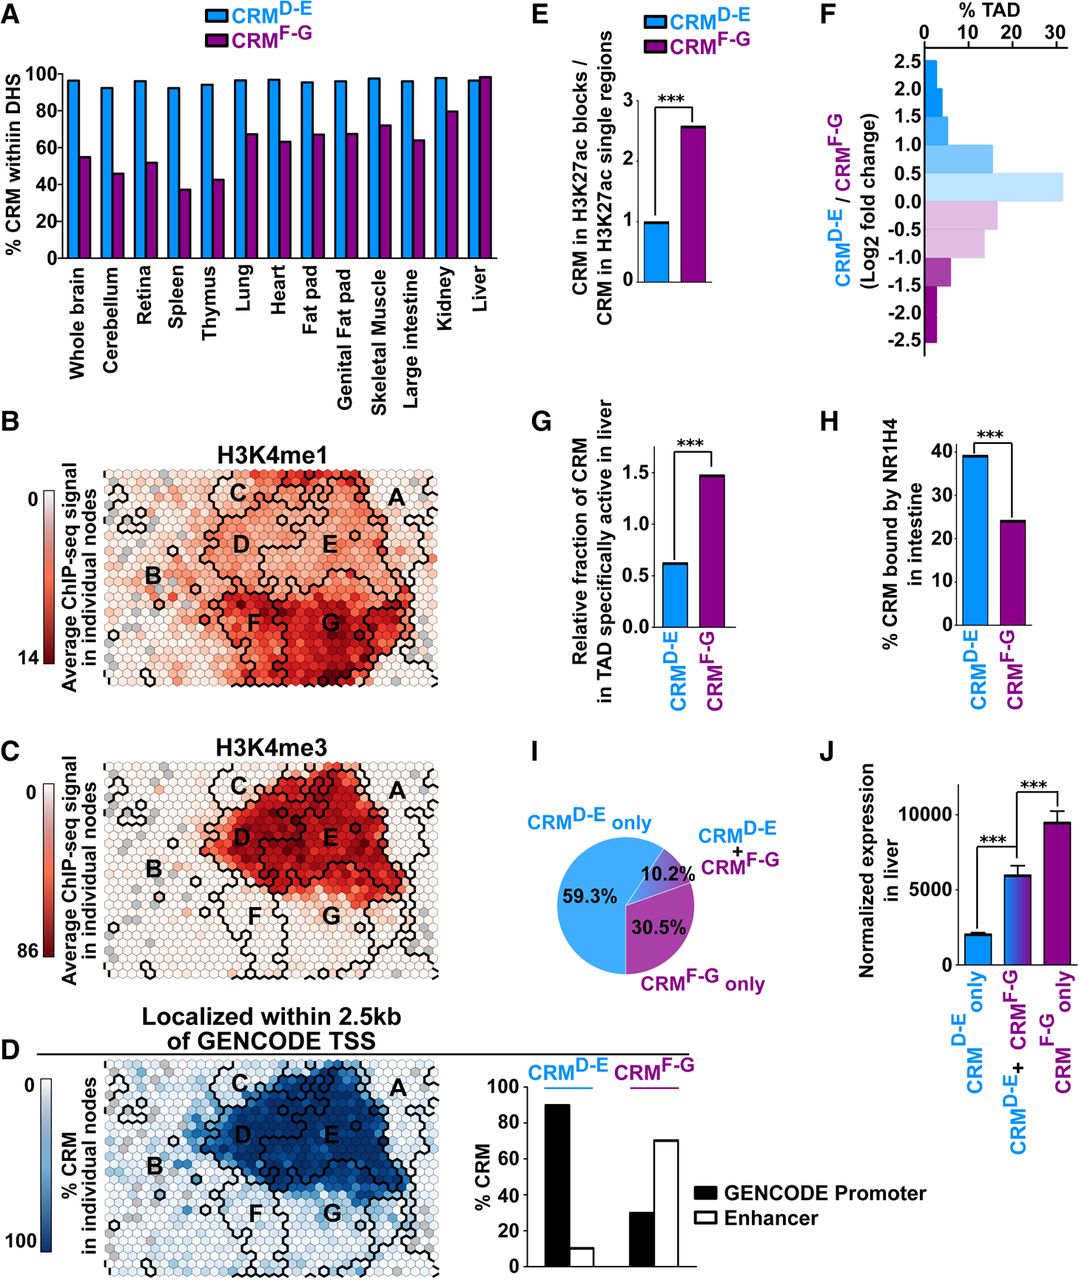
CRM from classes D-E and F-G differ in their identity, activity across tissues, and genomic distribution. (A) CRMsD-E or CRMsF-G were intersected with DHS sites identified in the indicated mouse tissues by the ENCODE Consortium (Vierstra et al. 2014). (B–D) The map issued from Figure 1B was used to indicate the H3K4me1 (B) or H3K4me3 (C) ChIP-seq levels as well as the percentage of CRMs localized within 2.5 kb of a GENCODE TSS (D) in each node. Bold black lines indicate the borders of the clusters. The bar graph in D summarizes the percentage of CRMsD-E and CRMsF-G labeled as promoters or enhancers. (E) Active CRMs were defined as enriched for H3K27ac in the mouse liver genome using data from Yue et al. (2014) and were grouped into blocks when separated by less than 12.5 kb. The bar graph shows the number of CRMs found into clusters, i.e., comprised within the aforementioned blocks, relative to those found outside clusters, i.e., single regions. Fisher's exact test was used to define statistically significant differences between CRMsD-E and CRMsF-G; (***) P < 0.001. (F) CRMsD-E and CRMsF-G found in active mouse TADs identified in Zhao et al. (2013) were counted and normalized to the respective total number of CRMs. The bar plot shows the frequency distribution of TADs with a different ratio of CRMsD-E relative to CRMsF-G. (G) A similar analysis was performed using TADs specifically active in the mouse liver (Zhao et al. 2013), and results were plotted as a bar graph. Fisher's exact test was used to define statistically significant differences between CRMsD-E and CRMsF-G; (***) P < 0.001. (H) CRMsD-E and CRMsF-G also identified as NR1H4 binding sites in the mouse liver in Thomas et al. (2010) were compared to intestine NR1H4 binding sites from the same study. Fisher's exact test was used to define statistically significant differences between CRMsD-E and CRMsF-G; (***) P < 0.001. (I) Percentage of genes uniquely associated with CRMsD-E (CRMsD-E only) or CRMsF-G (CRMsF-G only) or associated with both (CRMsD-E + CRMsF-G). (J) Average-normalized mRNA expression levels of genes uniquely associated with CRMsD-E (CRMsD-E only) or CRMsF-G (CRMsF-G only) or associated with both (CRMsD-E + CRMsF-G) in the mouse liver was obtained using BioGPS data (Wu et al. 2009). Results are means ± S.E.M. One-way ANOVA with Bonferroni's multiple comparison test was used to define statistically significant differences; (***) P < 0.001.


