
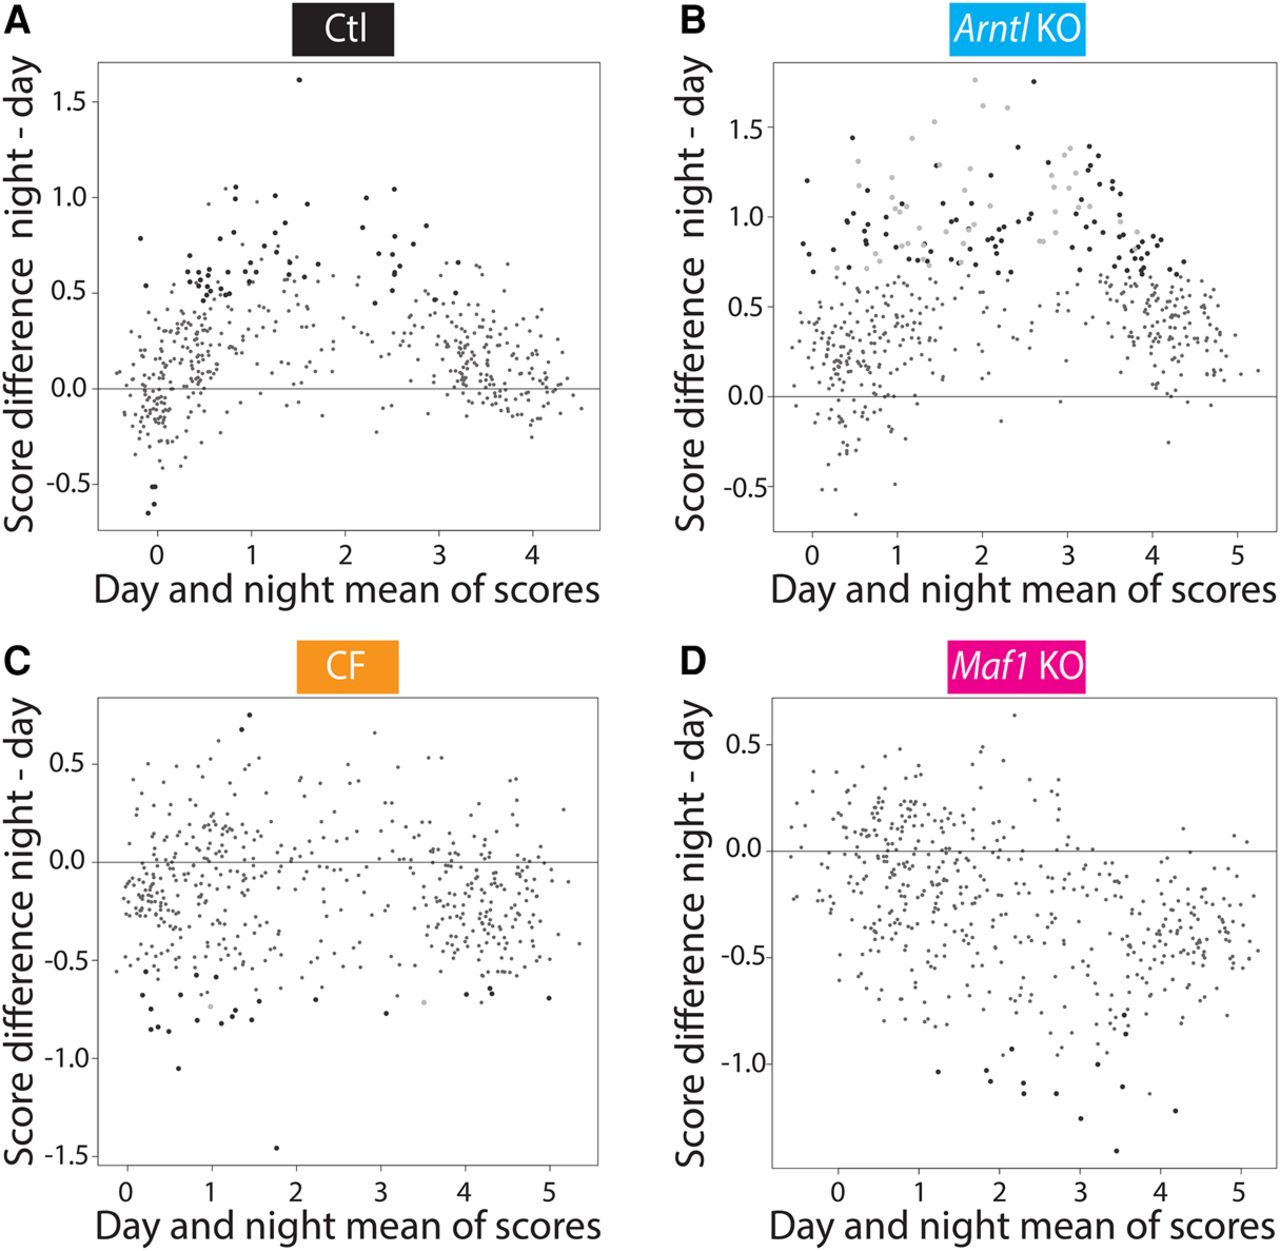
Nutrient-dependent increase of Pol III gene occupancy. (A) MVA plot comparing day and night average scores. For each locus, the three day scores were averaged and the three night scores were averaged. The MVA plot shows the average of day averages and night averages on the x-axis and the difference of night average – day average scores on the y-axis. Large black dots represent genes with significantly different day average and night average scores (P-value <0.05), as calculated with limma. (B) As in A, but for Arntl KO mice. The large black dots represent genes changing with a P-value <0.05 only in the Arntl KO mice, and the large gray dots represent genes changing with a P-value <0.05 in both the control and the Arntl KO mice. (C) As in A, but for the CF mice. The large black dots represent genes changing with a P-value <0.05 only in the CF mice, and the large gray dots represent genes changing with a P-value <0.05 in both the control and CF mice. (D) As in A, but for the Maf1 KO mice. The large black dots represent genes changing with a P-value <0.05 only in the Maf1 KO.


