
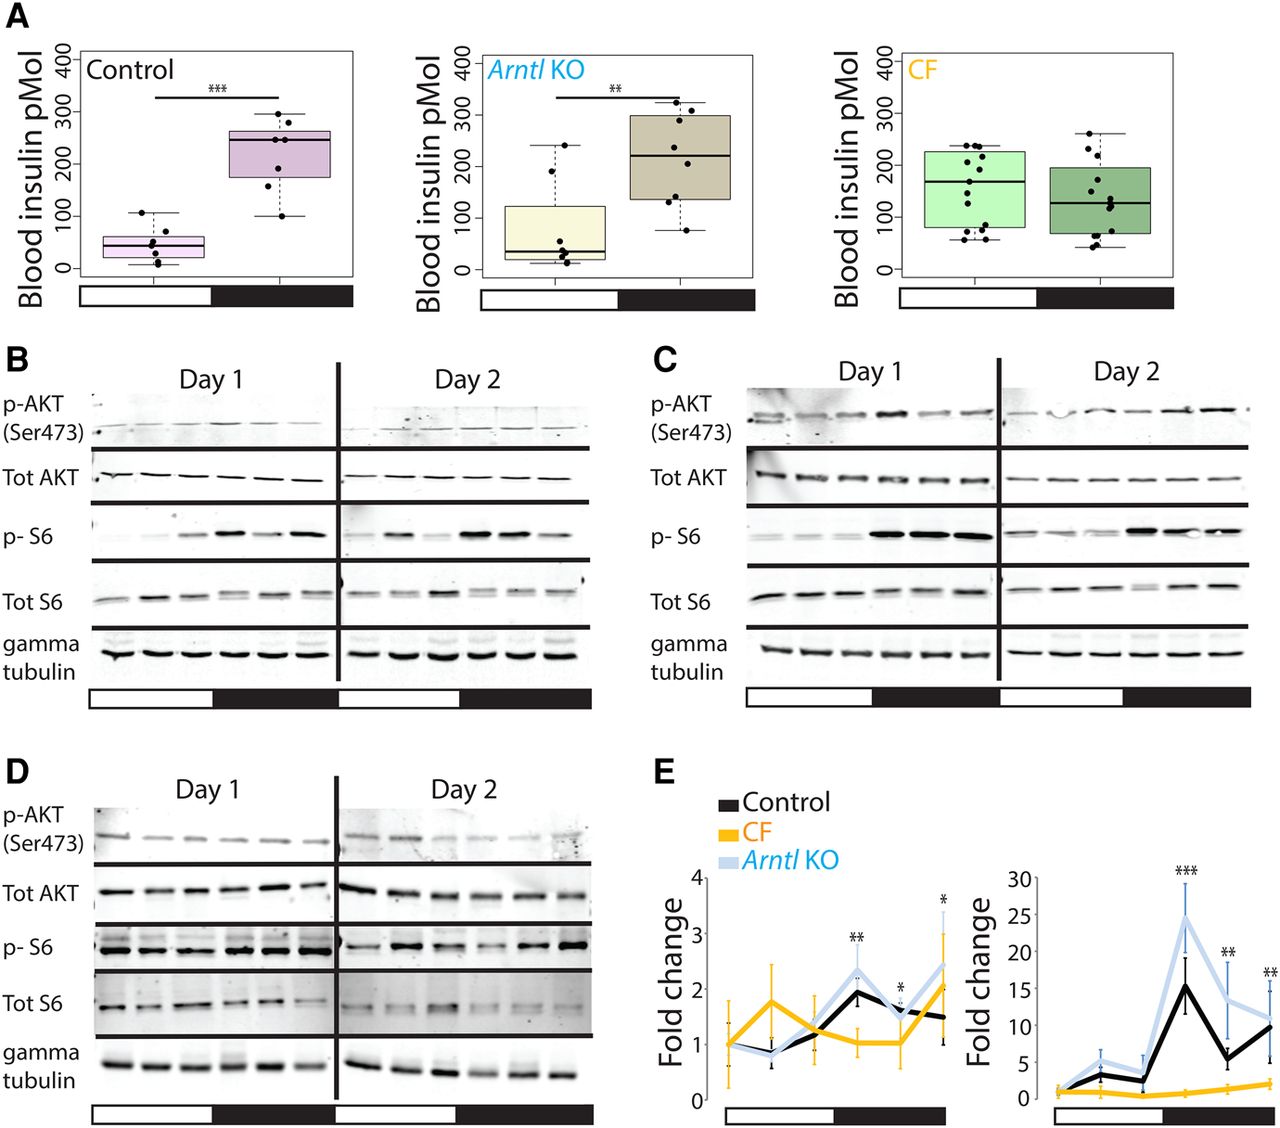
Effects of CF and Arntl KO conditions on nutrient-response mediators. (A) Night and day blood insulin concentration in control, Arntl KO, and CF mice. Each box plot represents the distribution of blood insulin concentration at different time points during the day (ZT02, ZT06, ZT10) and the night (ZT14, ZT18, ZT22). The horizontal black line is the median, and each point is the value for a given mouse: (***) P-value <0.0005; (**) P-value <0.005. (B) Immunoblots of control mouse liver samples collected every 4 h for 2 d and probed with antibodies directed against the antigens indicated on the left: p-AKT, AKT phosphorylated on serine 473, tot AKT, total AKT; p-S6, S6 phosphorylated on serines 235/236; Tot S6, total S6. Gamma tubulin was used as loading control. (C) As in B, but with Arntl KO mice liver samples. (D) As in B, but with CF mice liver samples. (E) Quantitation of the immunoblot signal fold changes obtained for phosphorylated AKT/Total AKT (left) and phosphorylated S6/Total S6 (right). Mean immunoblot signals were calculated for control (black, 3–5 samples per time point), Arntl KO (blue, 3–5 samples per time point), and CF (orange, 4–6 samples per time point) mice, and the signal at ZT02 was set at 1. For each condition, P-values were calculated for each night time point compared with the mean of all the day time points: (***) P-value <0.0005; (**) P-value <0.005; (*) P-value <0.05.


