
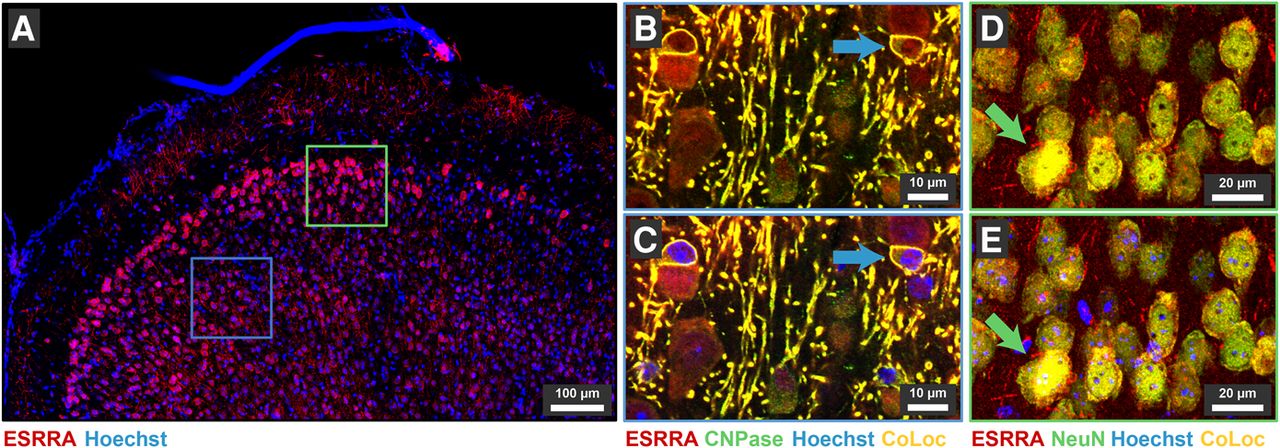
Figure 6.
Localization of ESRRA. (A) Sagittal overview showing FCX distribution of ESRRA protein (red) with nuclei counterstained by Hoechst 33342 (blue). Blue and green boxes show approximate positions of panels B,C and D,E, respectively. (B,C) Fine detail in the FCX showing colocalization of ESRRA (red) and CNPase (green) in individual oligodendrocytes (blue arrow) without (B) and with (C) nuclear counterstain (blue). (D,E) Fine detail in the FCX showing costaining of ESRRA (red) and NeuN (green) in individual neurons (green arrow) without (D) and with (E) nuclear counterstain (blue).


