
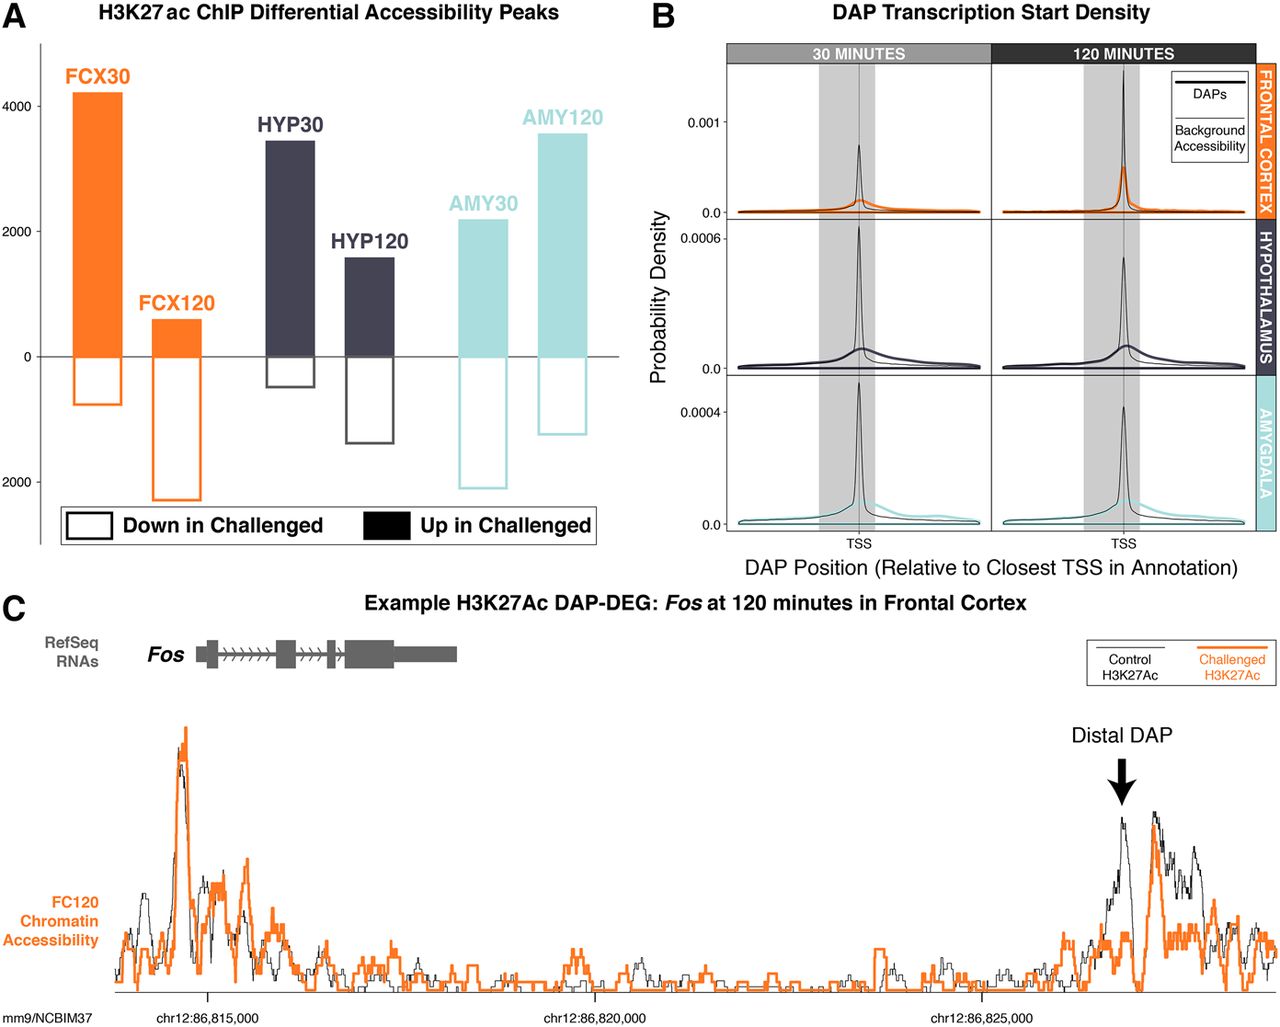
(A) H3K27ac DAPs in pairwise comparisons at a threshold of twofold. Solid bars above the x-axis represent peaks with increased accessibility in experimental samples relative to control. Outlined bars below the x-axis represent peaks with decreased accessibility in experimental samples. (B) Probability density of locations of differential accessibility in a 30-kb window around TSS sites. While the highest density of DAPs still lies within 5 kb upstream of or 2 kb downstream from (gray boxes) the TSS, the majority of DAPs are distal. Relative to background accessibility (thin black lines), DAPs have lower density near the TSS and higher density at distal sites. (C) Example distal differential accessibility peak in a known distal enhancer element for the immediate early gene Fos in FCX at 120 m after challenge.


