
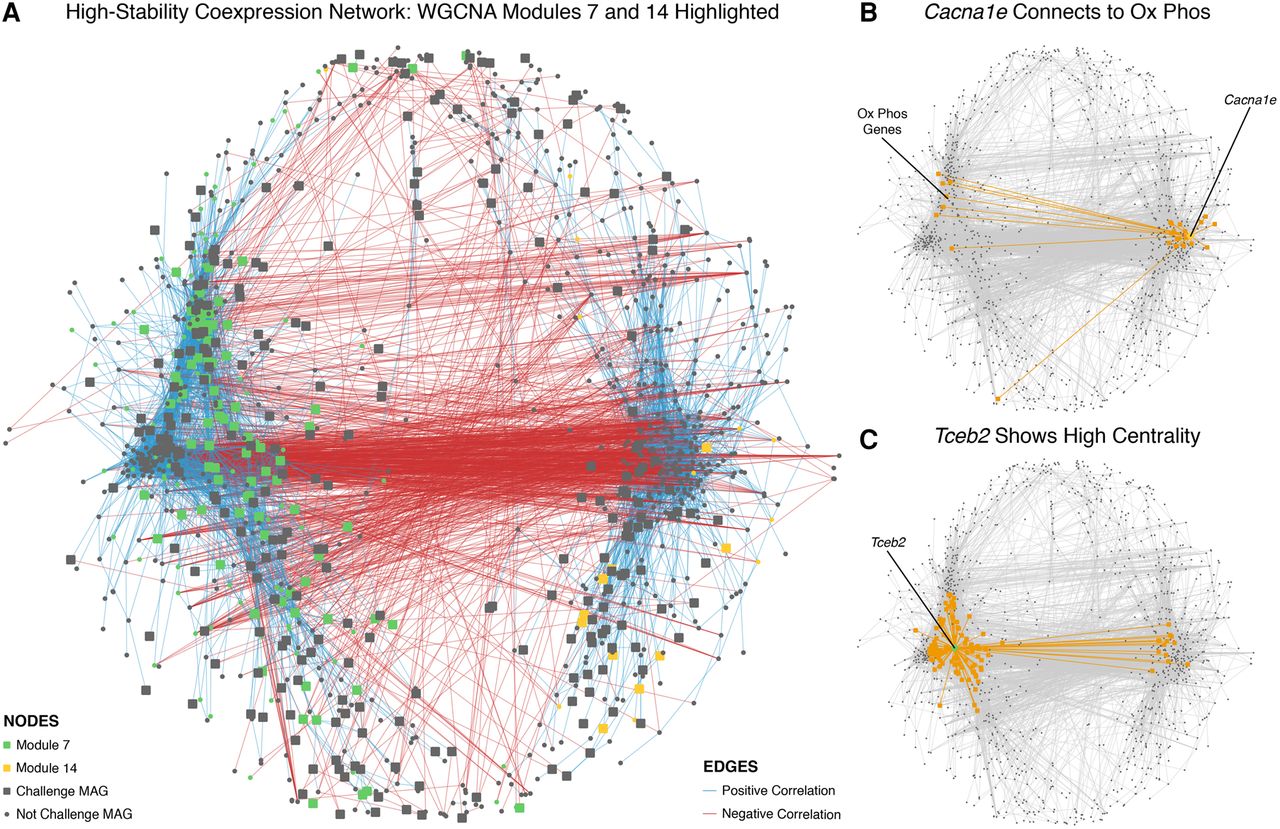
(A) Coexpression network of plotting the largest connected component with all relationships with correlations of an absolute value of 0.85 or better. The network topology includes two sides connected by a profusion of negative correlations. Module 7 nodes (green), which are associated with oxidative phosphorylation, inversely connect to module 14 nodes (yellow), which are associated with ion channels. (B) The gene with the highest betweenness centrality in module 14, Cacna1e, connects to many oxidative phosphorylation genes. Edges connecting out from Cacna1e and the nodes they connect to are highlighted in orange. (C) The gene with the highest betweenness centrality in module 7, Tceb2, implies a role for transcriptional regulatory dynamics. Edges connecting out from Tceb2 and the nodes they connect to are highlighted in orange.


