
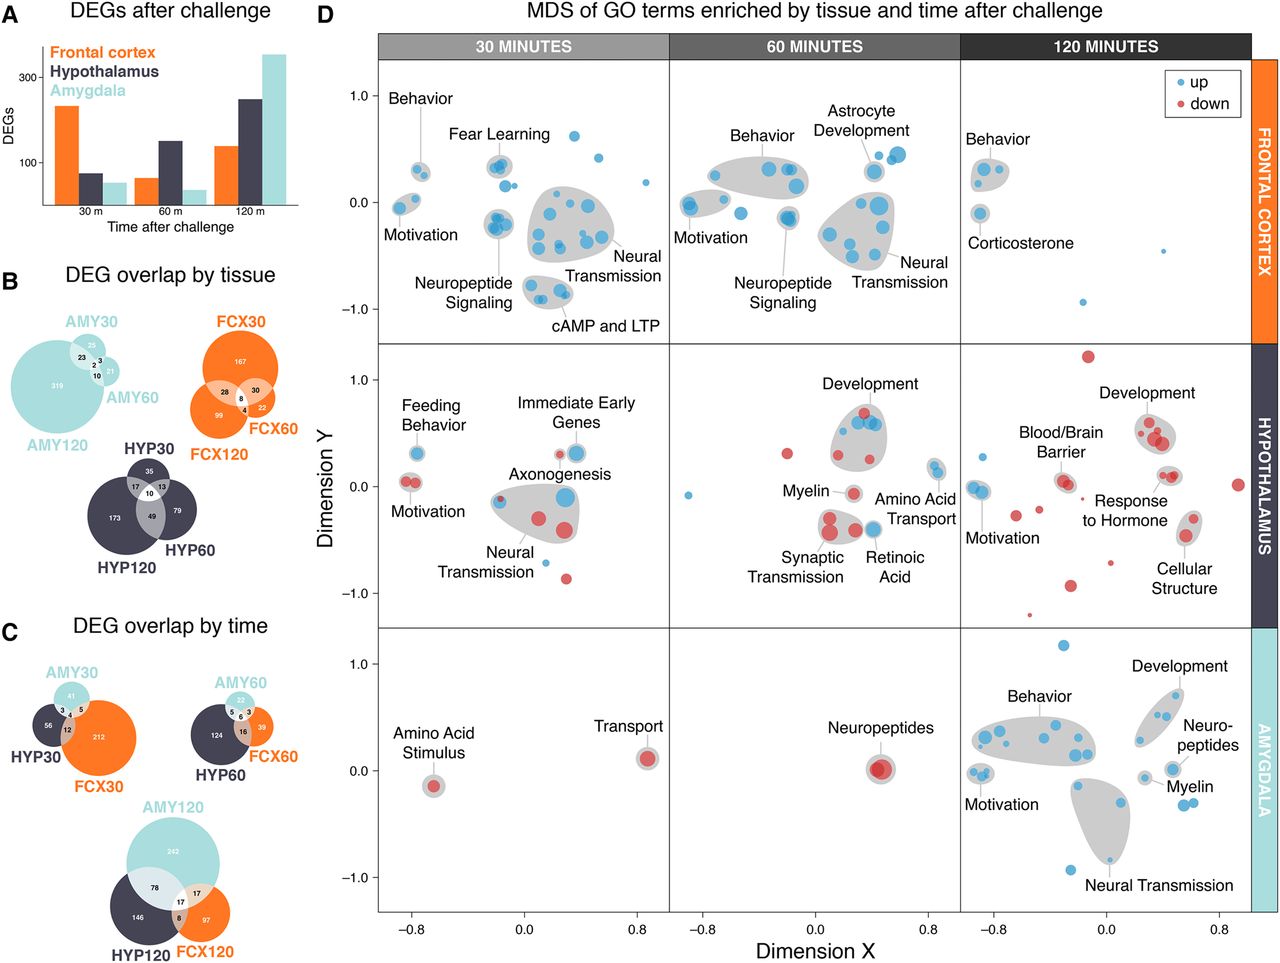
Figure 2.
DEGs at FDR < 0.10 in the intruder versus control comparison for each combination of brain region and time point after intruder. (A) Plot of DEGs by time point after intruder. (B) Plots of overlap between time points after intruder within each brain region. (C) Plots of overlap between brain regions within each time point after intruder. (D) Semantic MDS plot projecting the spatial and temporal pattern of enriched GO biological processes (BPs). Distances represent GO semantic dissimilarity as measured by simRel. Point size represents log-fold-change of a GO BP term. Point color represents direction of differential expression of a GO BP term.


