
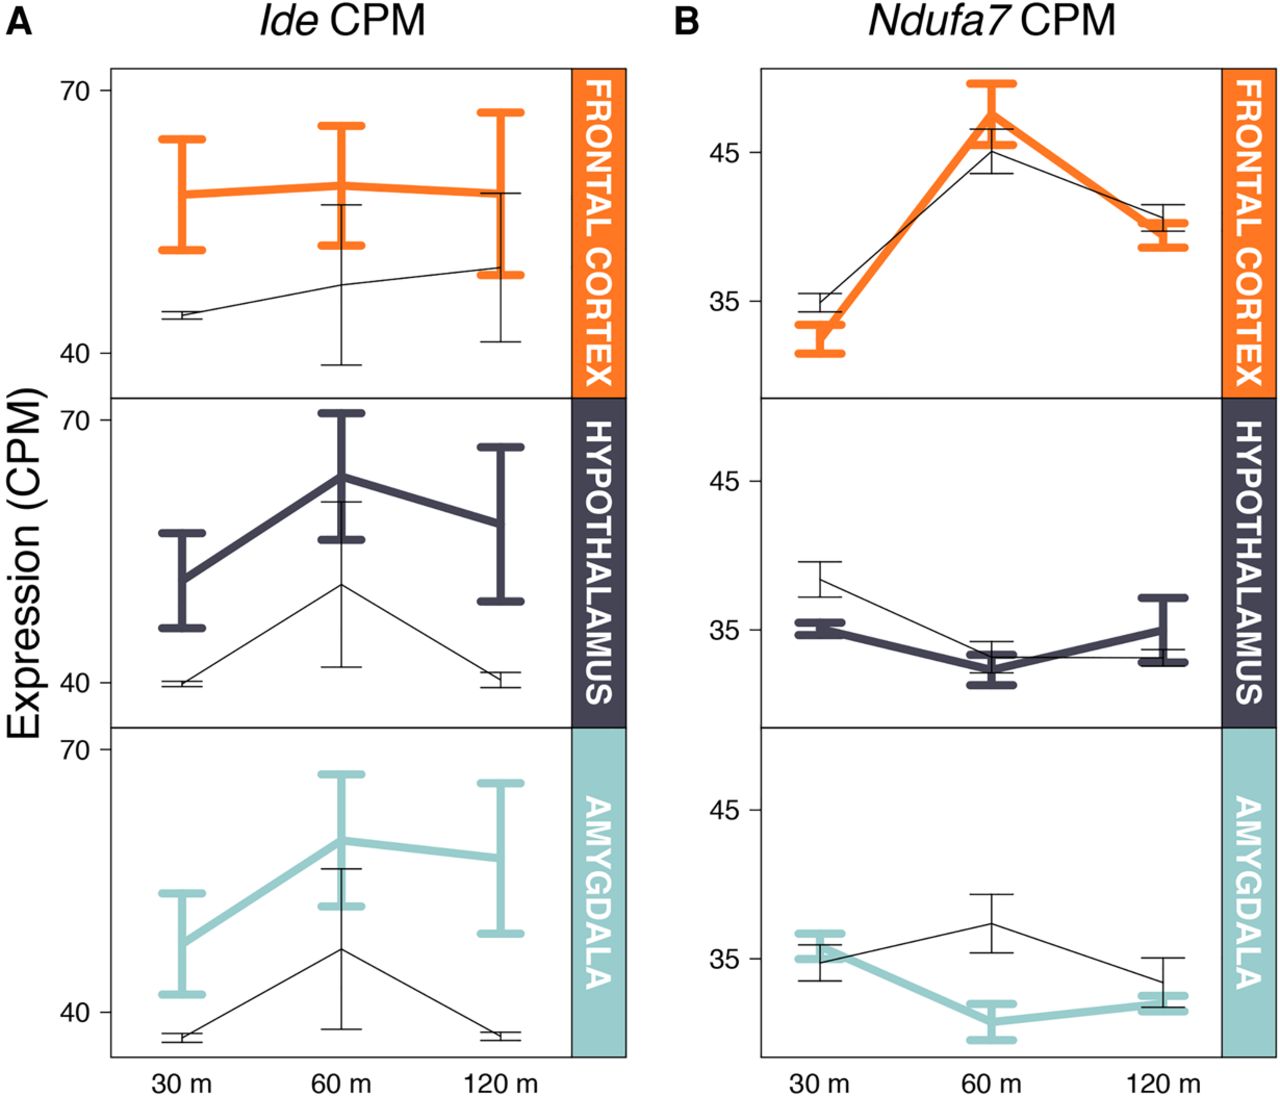
Figure 1.
Expression patterns for Ide (A), the top DEG in the challenge factor of the GLM, and Ndufa7 (B), the top DEG in the tissue:challenge:time interaction factor of the GLM. Thin black lines are control samples, while thick colored lines are experimental samples. Error bars, SEM.


