
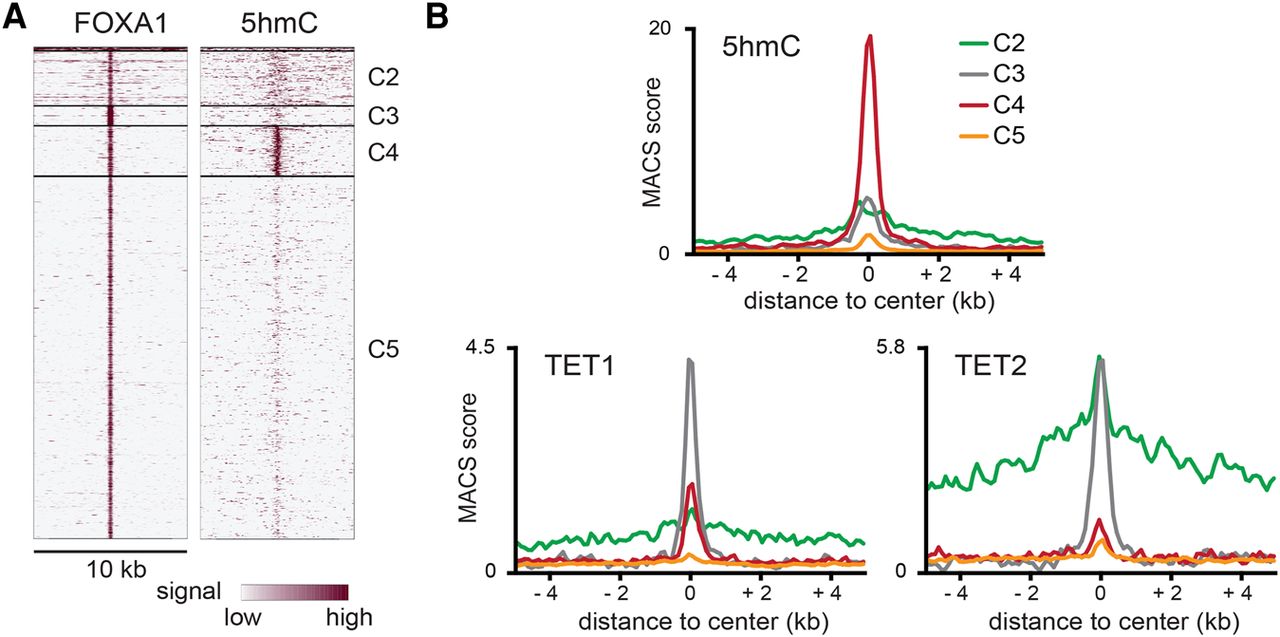
Figure 5.
High levels of 5hmC correlate with low levels of TETs at FOXA1-bound enhancers. (A) Heat maps of FOXA1 and 5hmC signals in clusterized FOXA1 binding regions outside CpG islands. (B) Average profiles of 5hmC, TET1, and TET2 recruitment at the C2, C3, C4, and C5 clusters shown in A.


