
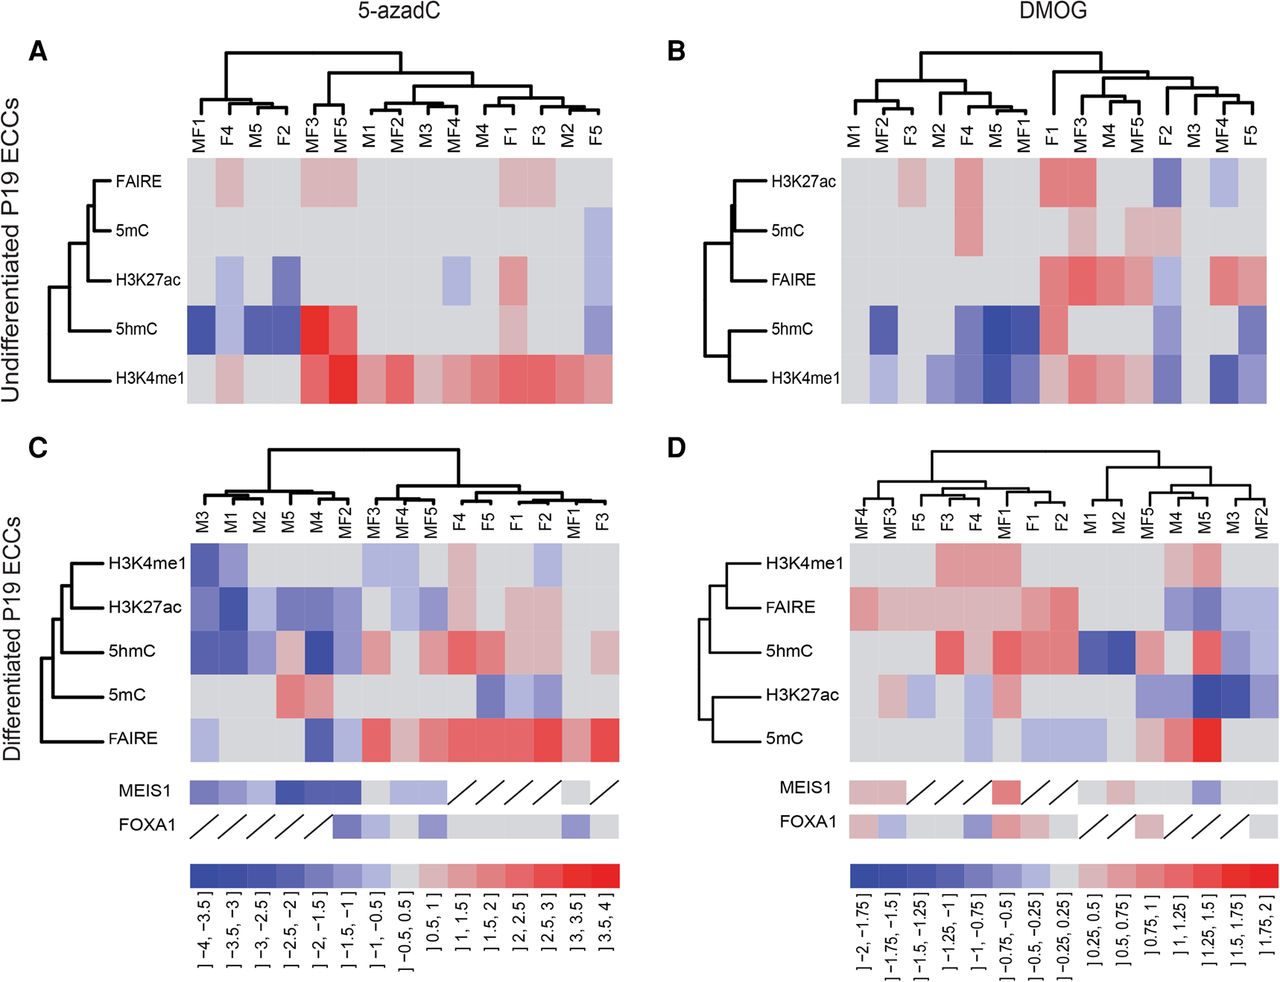
Figure 4.
Cytosine modifications regulate enhancer priming. Dendrograms and heat maps from hierarchical clustering of enhancer features (left dendrogram) and the 15 selected enhancers studied (top dendrogram). (A,B): undifferentiated P19 ECCs. (C,D): differentiated neural progenitors. The color scale bars at the bottom of each column indicate log2-transformed fold-change between control cells and cells treated with the inhibitor, with a scale of 0.5 for 5-azadC (A,C) and 0.25 for DMOG (B,D). Variations in MEIS1 and FOXA1 recruitment are represented below heat maps in panels C and D but were not used for hierarchical clustering.


