
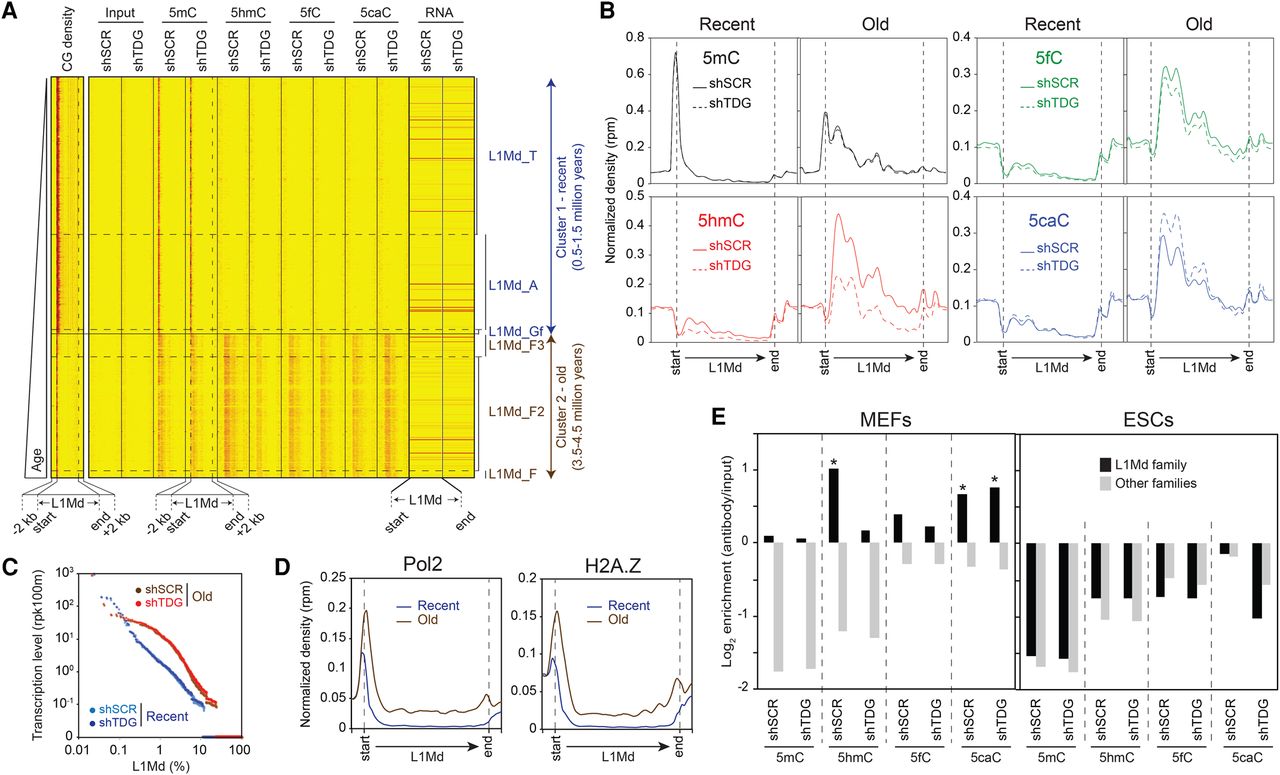
Distinct TDG-dependent DNA methylation patterns at full-length L1Md. (A) Heatmaps of 5mC/5hmC/5fC/5caC/CG densities and transcription levels in control and Tdg-deficient MEFs at full-length L1Md elements (length > 5 kb, n = 12,916), sorted relative to their appearance in the mouse genome. Tag densities were collected in 50-bp sliding windows spanning 2 kb (divided in 10 bins) of the length-normalized L1Md (divided in 40 bins). Two distinct clusters are identified: cluster 1, containing the youngest subfamilies L1Md_T, L1Md_A, and L1Mf_Gf (0.5–1.5 million years old); and cluster 2, containing the oldest subfamilies L1Md_F, L1Md_F2, and L1Md_F3 (3.5–4.5 million years old). (B) Average 5mC/5hmC/5fC/5caC signals at L1Md in control and Tdg-deficient MEFs reveal two distinct profiles. The evolutionarily recent L1Md subfamilies contain a hypermethylated 5′ UTR region, whereas the oldest subfamilies show a TDG-dependent dynamic of 5mC oxidation derivatives along their coding sequence. (C) Transcription levels of each individual element of the recent and old L1Md subfamilies in control and Tdg-deficient MEFs. (D) Normalized densities of Pol2 (left), H2A.Z (right) at recent (T/A/Gf), and old (F/F2/F3) L1Md subfamilies. (E) Relative enrichment for each cytosine modification at indicated LINE families in control and Tdg-deficient MEFs (left) and ESCs (right). (*) P-value <0.05.


