
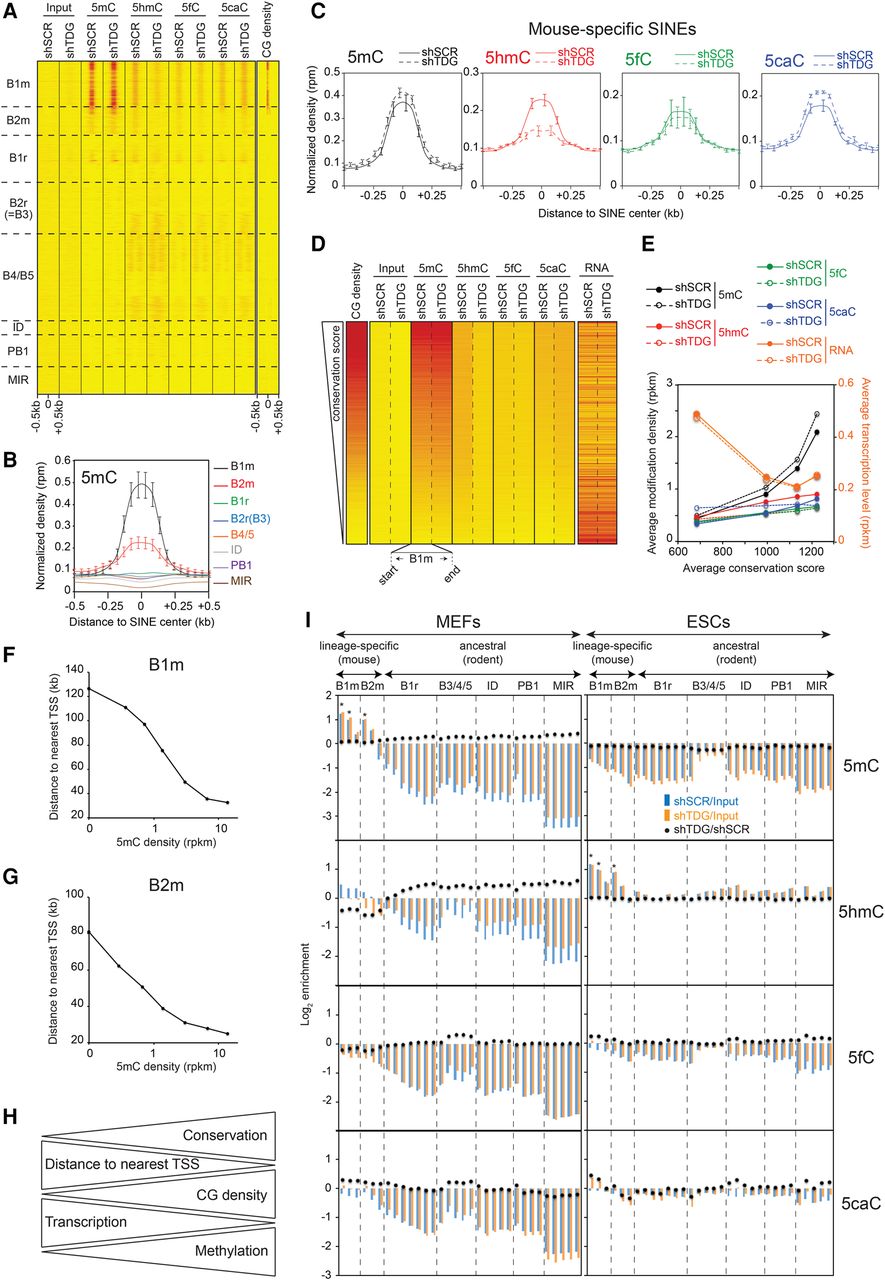
Specific TDG-dependent DNA methylation dynamics at the evolutionarily youngest SINEs. (A) Heatmaps of 5mC/5hmC/5fC/5caC/CG densities at SINEs (n = 1,511,580), sorted by family. Tags were counted within 500 bp around the SINE center. (B) 5mC densities in control MEFs for the indicated SINE families. (C) Average 5mC/5hmC/5fC/5caC signals in control and Tdg-deficient MEFs at mouse-specific SINEs. (B,C) Values represent means of two biological replicates. Error bars represent the range of the duplicate values. (D) Heatmaps of average 5mC/5hmC/5fC/5caC/CG densities and transcription levels in control and Tdg-deficient MEFs at B1m retroelements ranked by conservation score (n = 185,667). (E) Curves representing cytosine modification densities and transcription levels of B1m SINEs as a function of their conservation. B1m retroelements were sorted into quartiles based on their conservation score. Note the negative correlation between the methylation density and the transcription level of B1m SINEs. (F,G) Average distance to TSS of B1m (F) and B2m (G) elements as a function of their 5mC density. (H) Diagram illustrating the relationship between DNA methylation, CG density, transcription level, and distance to TSS for the mouse-specific B1m and B2m families. (I) Relative enrichment for each cytosine modification at each SINE subfamily in control and Tdg-deficient MEFs (left) and ESCs (right). SINE subfamilies were sorted in two groups relative to their appearance in the rodent lineage, the mouse-specific group and the ancestral group (common in rodents). Note that mouse-specific SINEs are specifically hypermethylated in MEFs but hydroxymethylated in ESCs. (*) P-value <0.05.


