
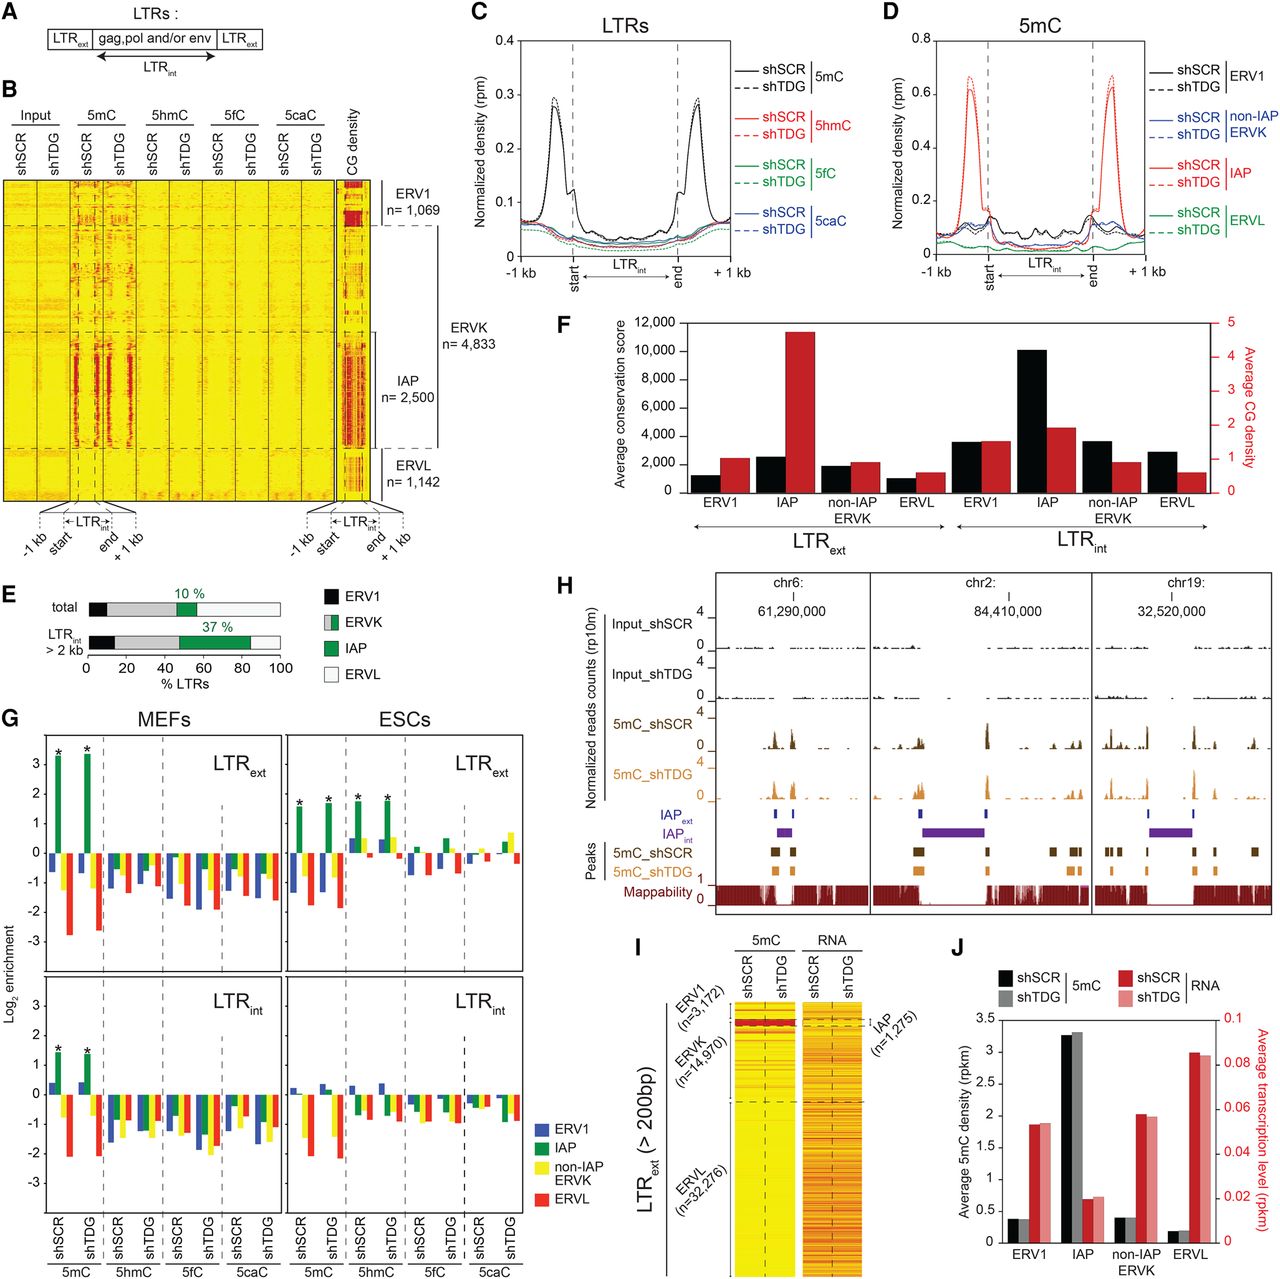
Specific DNA methylation profiles at recently integrated IAP LTRs in MEFs and ESCs. (A) RepeatMasker database distinguishes within the LTR family elements corresponding to the external terminal repeats (LTRext) from those corresponding to the internal coding regions (LTRint). (B) Heatmaps of 5mC/5hmC/5fC/5caC/CG densities at full-length LTRs (LTRint > 2 kb) in control and Tdg-deficient MEFs. Tag densities were collected in 50-bp sliding windows spanning 1 kb (divided in 15 bins) of the length-normalized LTRint (divided in 30 bins). LTR retroelements were sorted by families. (C) Average 5mC/5hmC/5fC/5caC signals in control and Tdg-deficient MEFs at LTRs. (D) 5mC densities for the indicated LTR families in control and Tdg-deficient MEFs. (E) Distribution of LTR classes in the mouse genome (total or full-length retroelements). (F) Average conservation score (black columns) and CG density (number of CpG dinucleotides per 100 bases, red columns) of LTRext (left) and LTRint (right) elements. (G) Relative enrichment for each cytosine modification in MEFs (left) and ESCs (right) at the indicated LTR families (LTRext regions, upper; LTRint regions, lower). Note the significant enrichment of 5hmC at LTRext IAP in ESCs. (*) P-value <0.05. (H) Genome browser views showing the lack of mappability at IAPint elements. (I) Heatmaps of average 5mC densities and transcription levels at LTRext elements (length >200 bp) in control and Tdg-deficient MEFs. (J) Histogram showing the negative correlation between methylation density and transcription level of LTRext elements in control and Tdg-deficient MEFs.


