
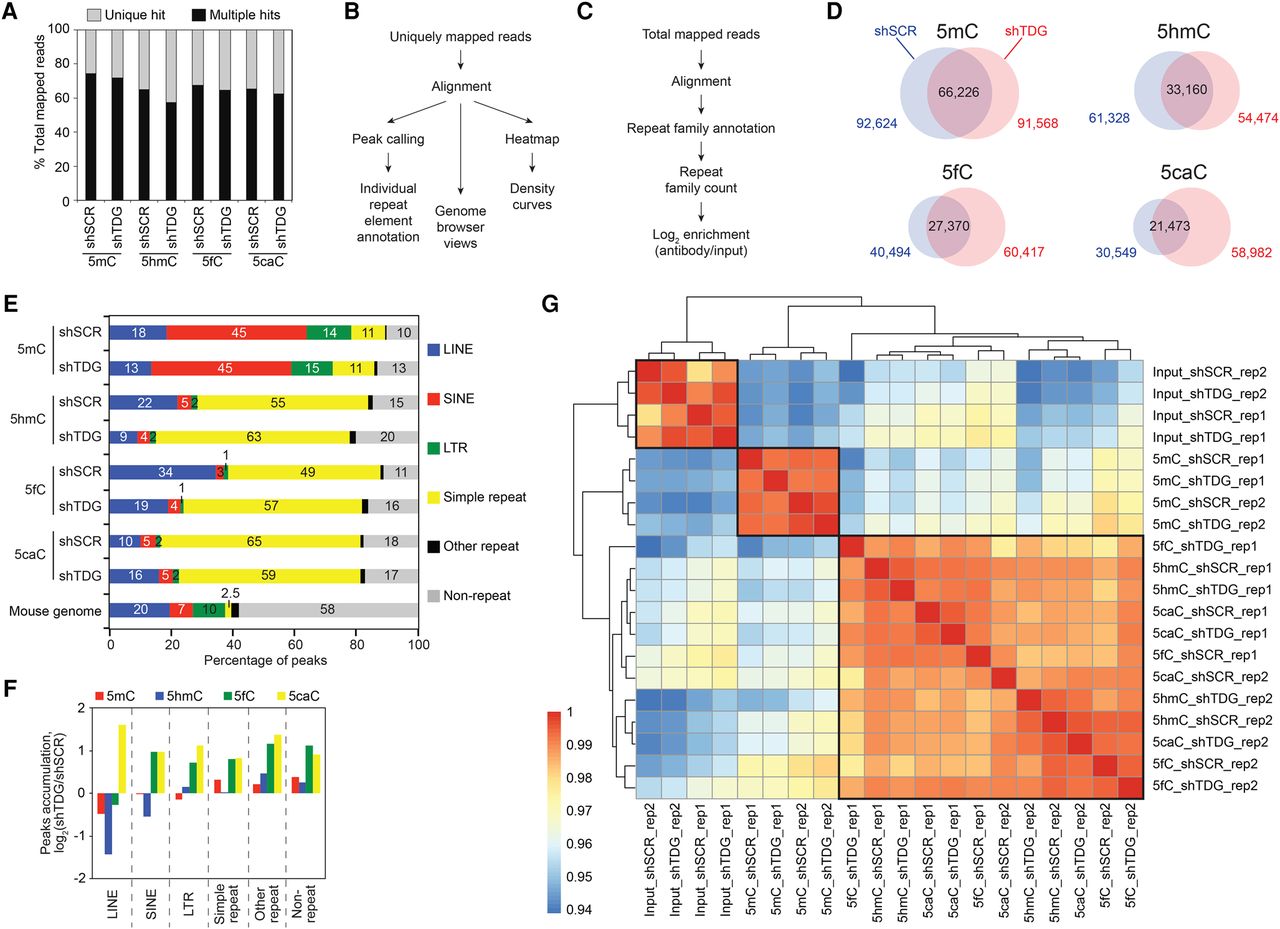
Preferential accumulation of 5mC, 5hmC, 5fC, and 5caC at repetitive elements in MEFs. (A) Percentages of uniquely mapped and multihit reads in total mapped reads (average of two replicates). (B,C) Flowchart of computational analyses used in this study using uniquely mapped reads (B) and including multihit mapped reads (C). (D) Venn diagrams showing the overlap between 5mC, 5hmC, 5fC, and 5caC peaks in control (shSCR) and Tdg-deficient MEFs (shTDG). (E) Percentages of peaks overlapping with repetitive elements using the UCSC RepeatMasker database. (F) Bar graph representation of the peak accumulation (fold change, fc = log2-ratio shTDG/shSCR) at repetitive elements in response to Tdg knockdown in MEFs. (G) Heatmaps with hierarchical clustering showing Spearman's rank correlations between all pairwise comparisons. Spearman correlations were calculated using the raw read count across all types of repeats analyzed. Note that the 5hmC, 5fC and 5caC profiles were closely clustered.


