
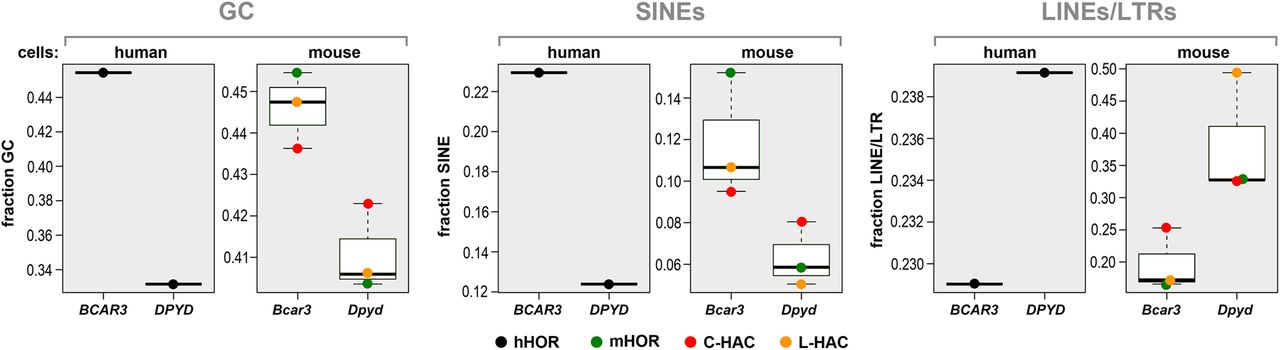
Figure 5.
Box plots showing the relative frequency of GC bases, SINE, and LINE/LTR elements of the trans interacting 4C-seq regions in human and mouse cells. Dots represent the characteristics of the 4C-seq trans interacting regions using different viewpoints on different chromosomes: hHOR, black; mHOR, green; L-HAC, orange; C-HAC, red. Median values are shown as horizontal black lines. BCAR3/Bcar3 genes represent the gene-rich segment and DPYD/Dpyd genes represent the gene-poor segment.


