
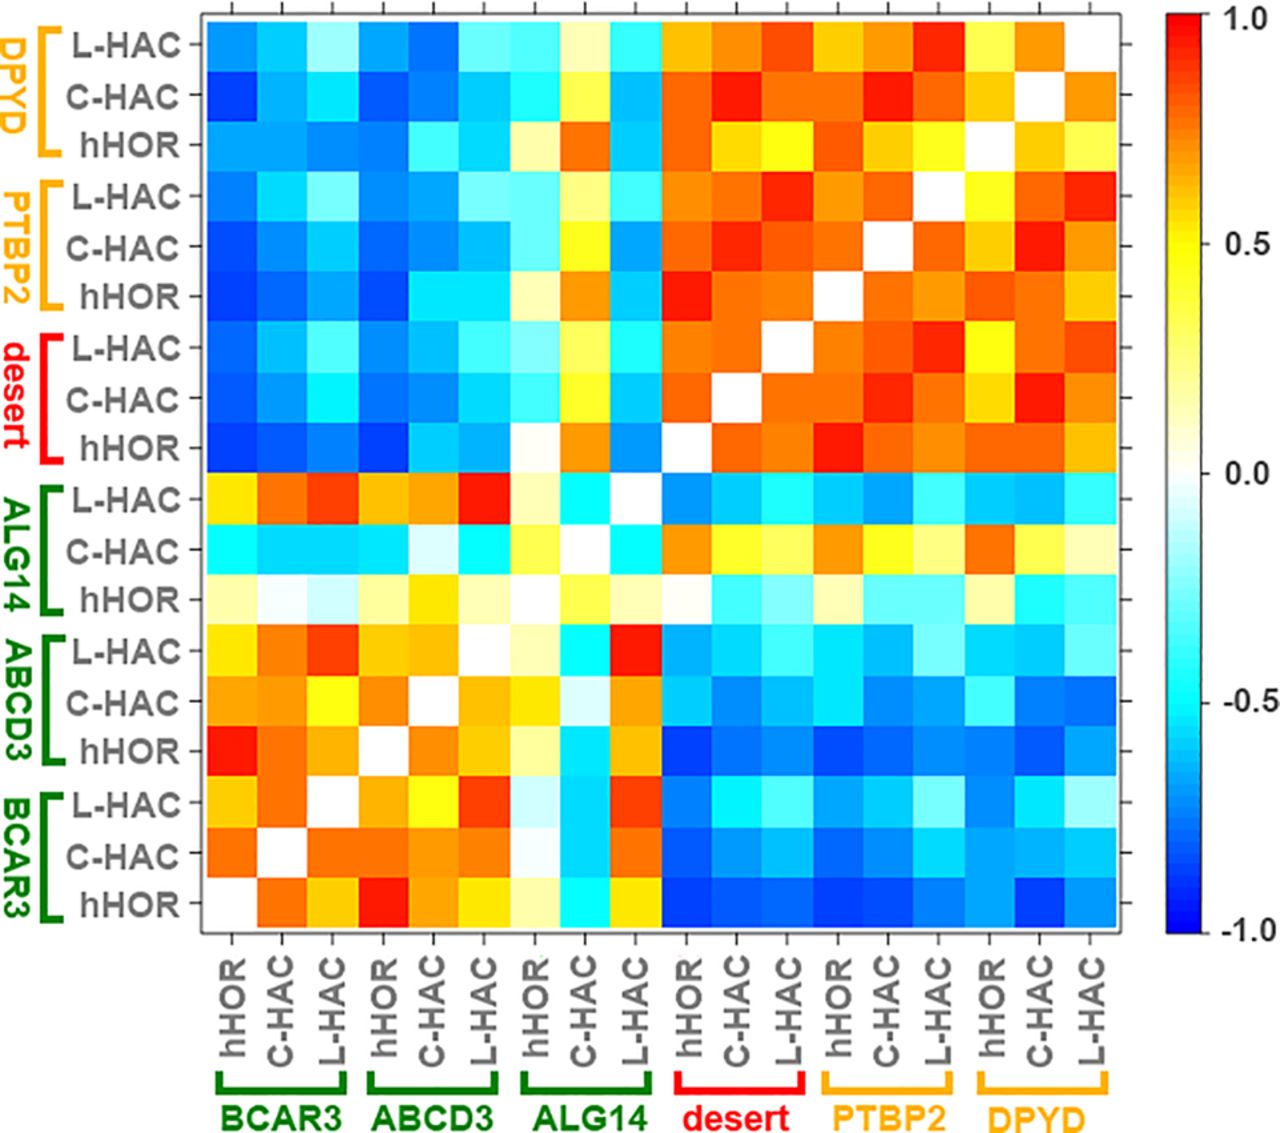
Figure 4.
Heat map of Spearman's rank correlation coefficients of the 4C-seq profiles of hHOR, C-HAC, and L-HAC. The corresponding 4C-seq profiles are shown in Figure 2A. 4C-seq data within 200 kb from each viewpoint were excluded. The colors range from anti-correlating (−1.0) blue to correlating red (1.0).


