
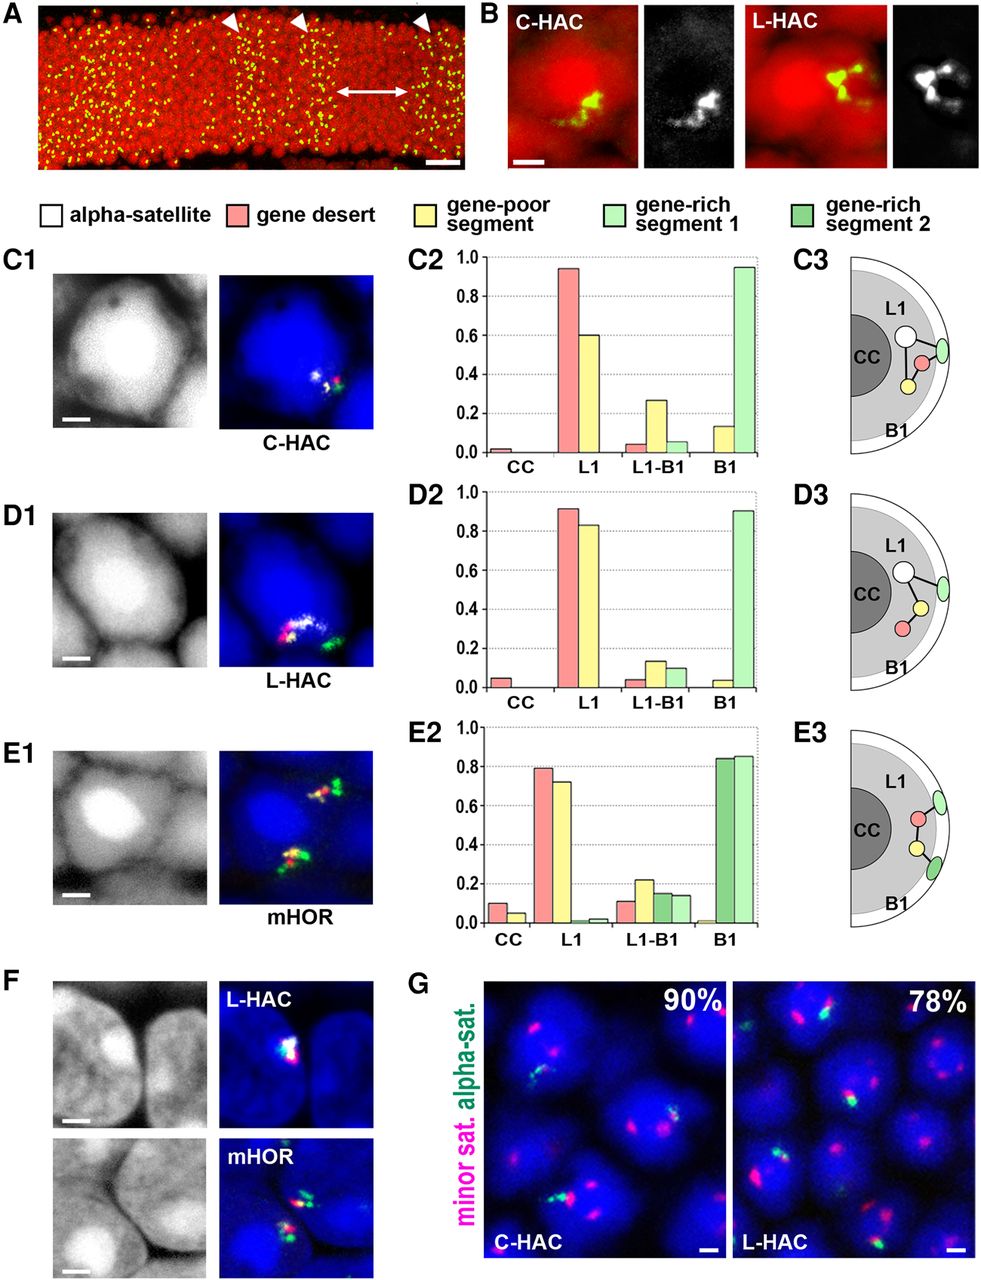
HAC and mHOR segments are faithfully positioned in the rod nuclear shells occupied by the same chromatin class. (A) FISH with human genomic DNA as a probe visualizes the HACs in the outer nuclear layer of the mouse retina. Note that some retinal clones are lacking HAC (as the ones marked by the arrow), in others (arrowheads) one HAC per cell is present. (B) FISH with human Cot1 as a probe reveals that the HAC is stretched from the central chromocenter to the nuclear periphery (left) or has a V-like structure (right). DAPI, red; FISH signal, green. Grayscale images of the signals are shown next to the RGB images. (C–E) Examples of rod nuclei after FISH with a cocktail BAC probe for differential segment labeling (C1, D1, E1), proportion of segments localized in rod nuclear zones (C2, D2, E2), and schematics of typical distributions of the HAC and mHOR segments in rod nuclei (C3, D3, E3). Note that every rod nucleus has one HAC but two alleles of mHOR. The chromocenter (CC), heterochromatic L1-zone (L1), and euchromatic B1-zone (B1) are indicated on the schematics and graphs. The y-axis on the graphs shows the fraction of segment signals from a total number of scored signals for a particular segment. For each segment, between 120 and 250 signals were scored. FISH signals are false-colored as follows: centromere signal, white; gene desert, red; gene-poor segment, yellow; gene-rich segments, green. (F) Higher degree of HAC compaction in conventional nuclei of the retinal cells from the inner nuclear layer. (G) Examples of HAC and mouse centromere colocalization. Numbers in the corner indicate percentage of rod nuclei with colocalized centromere signals; between 122 and 120 nuclei of rods carrying C-HAC and L-HAC, respectively, were scored. α-satellite, green; minor satellite, magenta. All FISH images are projections of a few optical sections encompassing 1–2 µm. Nuclei in C–G are counterstained with DAPI (blue). Scale bars: A, 20 µm; B–G, 1 µm.


