
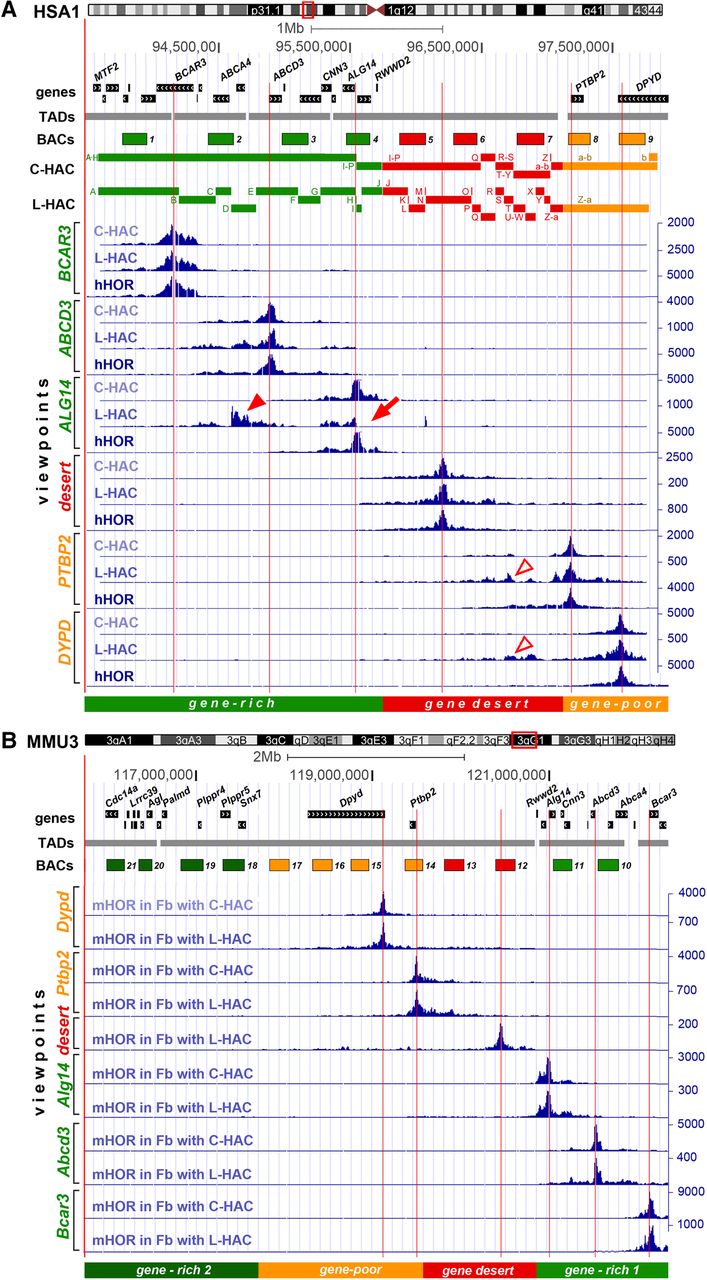
Structure and 4C-seq intrachromosomal contact profiles of the human region (hHOR) within the endogenous Chromosome 1 (HSA1) and HACs (A) and of the mouse endogenous region (mHOR) within Chromosome 3 (MMU3) (B) visualized by the UCSC Genome Browser. The sequence features of the chromosomal loci indicated by red open rectangles in the chromosome ideograms are viewed below the ideograms. Tracks, ordered from top to bottom, are: genes, TADs, BACs used for fluorescence in situ hybridization (FISH) in this study, C- and L-HAC sequence blocks, 4C-seq contact profiles of six viewpoints, division of the regions into segments according to gene abundance. The gene-rich segment is highlighted in light-green; gene-desert and gene-poor segments in red and yellow, respectively. BACs are marked as 1–9 and 10–21 for human and mouse regions, respectively; for the real BAC names, see Supplemental Table S1. An additional flanking gene-rich segment and corresponding BACs for the mouse region are depicted in dark green (B). Note that mHOR has an inverted orientation in comparison with hHOR. Vertical red lines indicate 4C-seq viewpoints. 4C-seq values are shown on the right y-axis in blue. Blocks of rearranged sequences in C-HAC and L-HAC are indicated in A and marked by letters A–Z/a-b as in Figure 1. Arrow and arrowheads point at L-HAC contact profiles regions noticeably altered compared to hHOR as a result of HAC structural rearrangements, such as abrupt depletion of contacts (arrow) and additionally gained contacts (arrowheads).


