
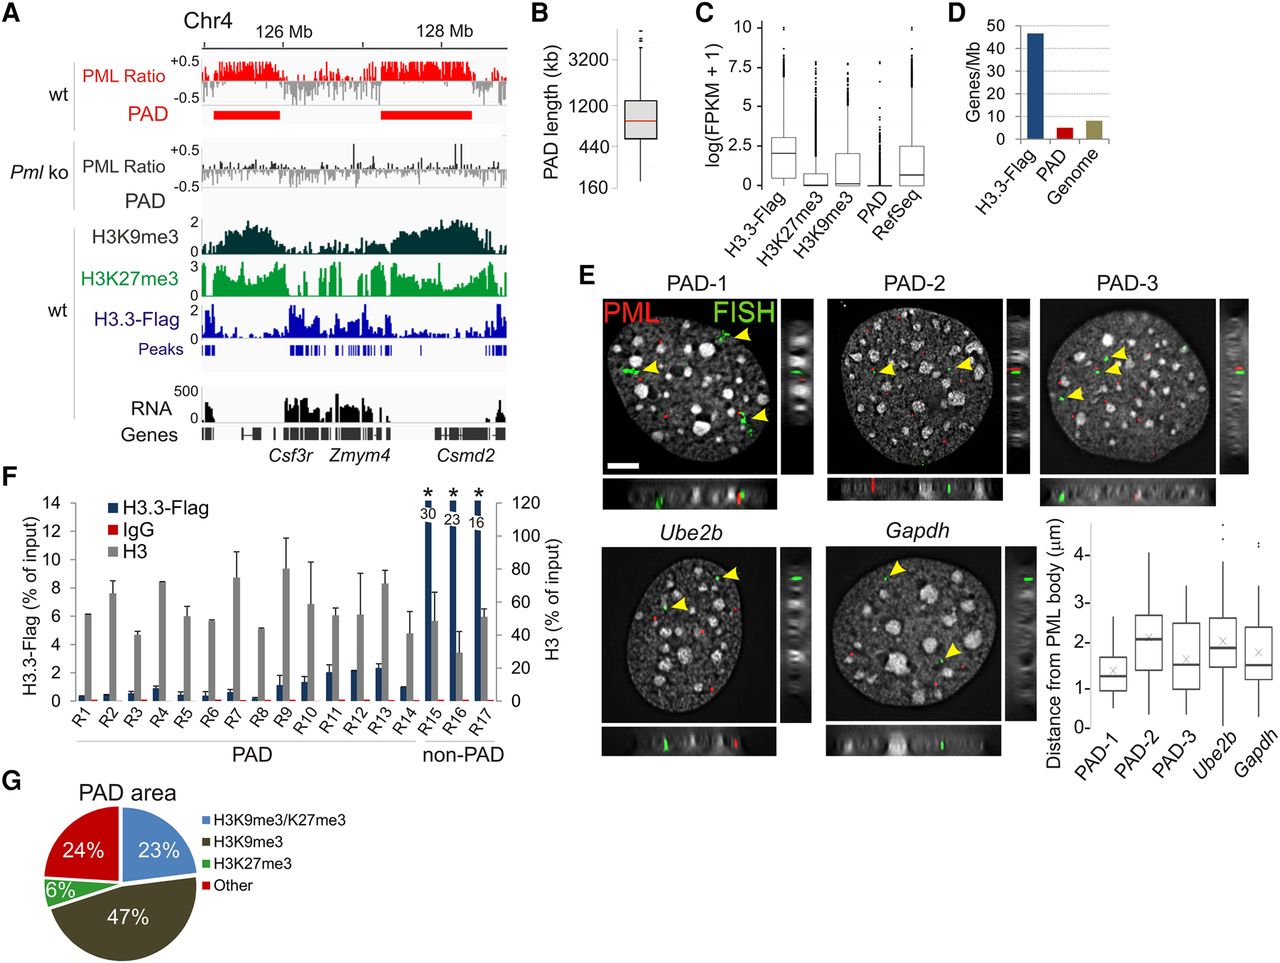
PML associates with large heterochromatin domains. (A) ChIP-seq profiles of PML in wt and Pml ko MEFs and of H3K9me3, H3K27me3, and H3.3-Flag in wt MEFs; data are shown as log(ChIP/input) ratios. RNA-seq counts (FPKM) are shown. (B) PAD length (median, 0.8 Mb). (C) Expression levels of genes enriched in H3.3-Flag, H3K27me3, and H3K9me3; genes in PADs; and of all RefSeq genes in wt MEFs. (D) Gene density within H3.3-Flag peaks, in PADs, and in the whole genome. (E) Immuno-FISH analysis of PML (showing PML bodies; immunolabeling, red signal) and PADs (green signal; arrows; FISH probes). Ube2b and Gapdh are shown as genes outside PADs. Planar and orthogonal views are shown. Bar, 5 µm. Graph indicates distribution of FISH probe distances to nearest PML body (about 60 FISH signals analyzed). (F) ChIP-qPCR of H3.3-Flag and total H3 in indicated PAD and non-PAD regions in wt MEFs. (*) P < 0.01 relative to H3.3-Flag at all other sites; two-tailed t-tests; mean ± SD, three experiments. See Supplemental Table 4 for position of amplicons. (G) PAD area coverage by H3K9me3 and/or H3K27me3 peaks in wt cells.


