
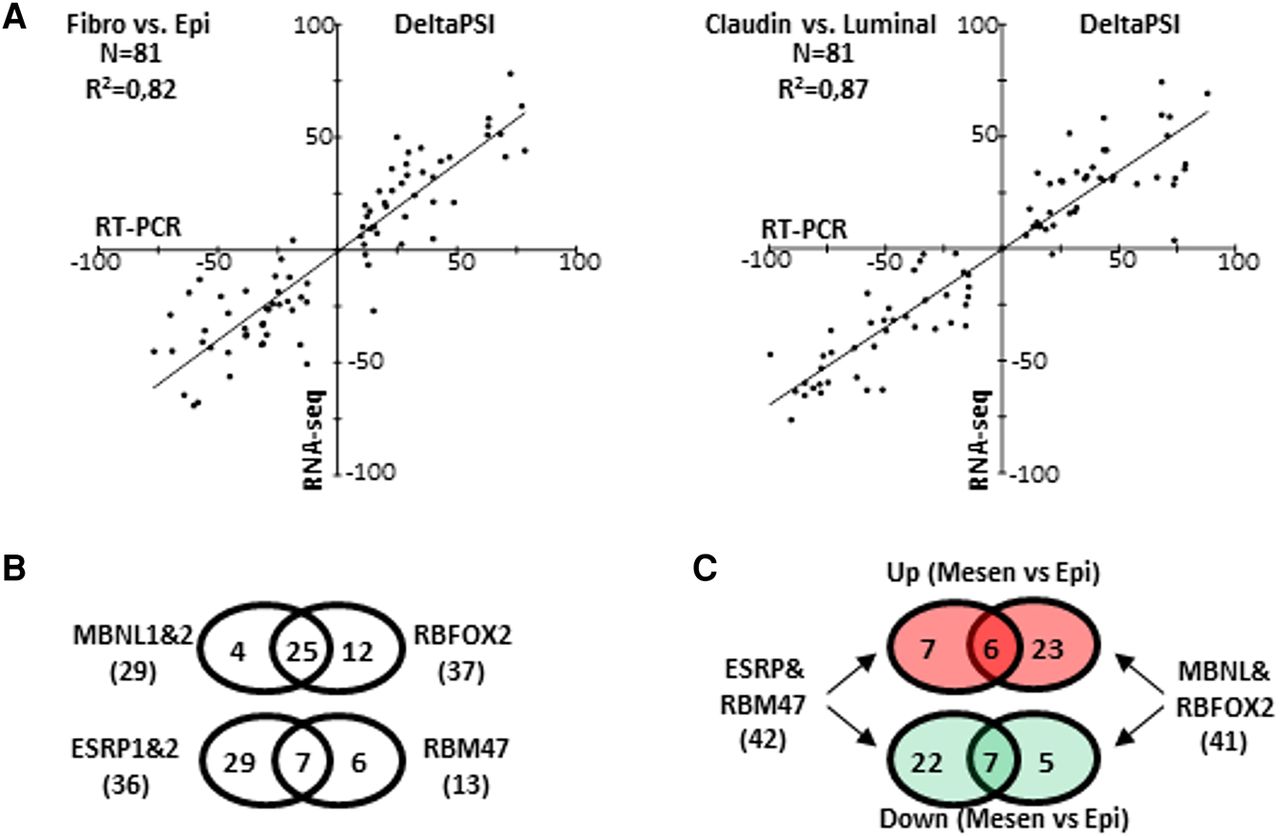
(A) Comparison of the percent splicing inclusion (psi) rate variations (deltaPSI) of the 81 exons of the “Mes-Epi” list, as measured by RT-PCR (x-axis) and by RNA-seq (y-axis). Exons are differentially spliced between normal fibroblast (Fibro) and normal epithelial (Epi) cells (left panel) and between Claudin-Low (mesenchymal-like) versus luminal (epithelial-like) breast cancer cells (right panel). (B) Venn diagram representing exons regulated by MBNL1&2 and RBFOX2 in MDA-MB-231 cells or regulated by ESRP1&2 and RBM47 in MCF-7 cells. Significant collusion was observed among mesenchymal and epithelial splicing factors, respectively. (C) Venn diagram representing exons more (red circles) or less (green circles) included in mesenchymal-like cells compared to epithelial-like cells and regulated by MBNL1&2, RBFOX2 (right), and ESRP1&2 and/or RBM47 (left).


