
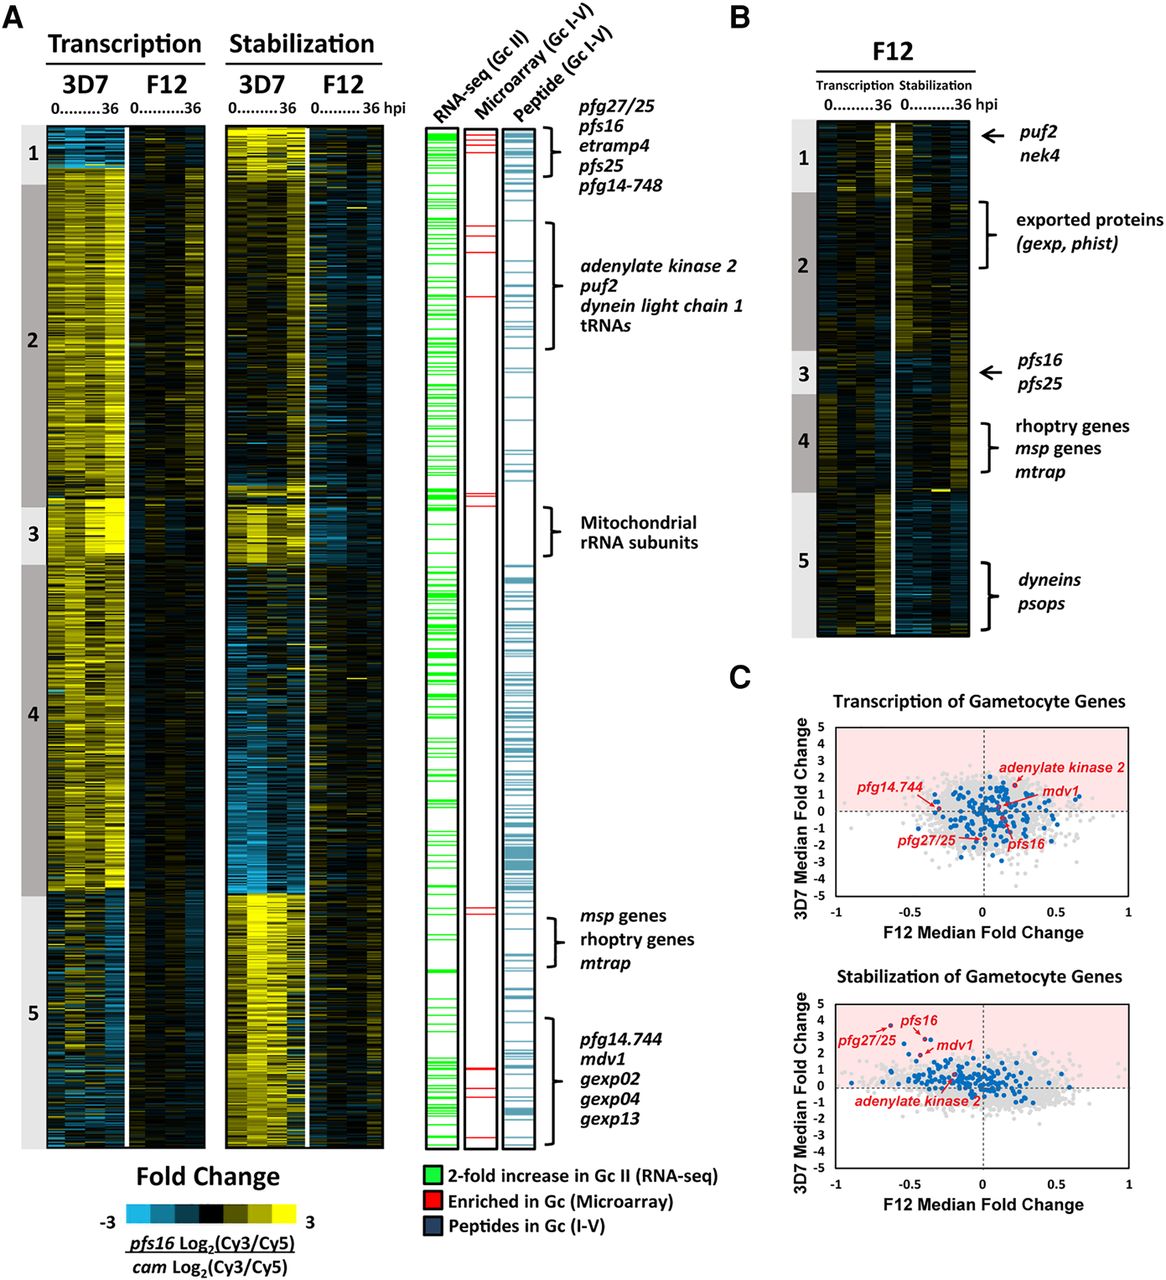
Dynamics of putative gametocyte-specific genes. (A) Genome-wide gametocyte transcription and stability was calculated by determining the fold change in Log2(Cy3/Cy5) ratio of 3D7pfs16/3D7cam. A total of 808 genes were identified as gametocyte-associated (≥1 log2 fold change, 95% percentile ranking) and ordered by K5 means clustering based on 3D7 (Supplemental Table S1). The gametocyte-associated genes identified were compared to previously published RNA sequencing analysis (green) (López-Barragán et al. 2011), DNA microarray (identified in ≥50% of analyses) (red) (Eksi et al. 2005, 2012; Silvestrini et al. 2005; Young et al. 2005; Mair et al. 2010; Brancucci et al. 2014; Pelle et al. 2015), and mass spectrometry identification of sexual-stage peptides (blue) (Silvestrini et al. 2010; Lindner et al. 2013; Tao et al. 2014). Genes characteristic of gametocytogenesis and newly identified gametocyte-associated genes are noted adjacent to the clusters in which they are enriched. (B) A subset of 431 of 808 genes identified as gametocyte-associated were significantly enriched in F12 (≥0.5 log2 fold change, 95% percentile ranking) and were ordered by K5 means clustering. Genes characteristic of both asexual invasion and gametocytogenesis are labeled. (C) Dot plots representing the median fold change (pfs16/cam) of each gene in both 3D7 and F12 transcription and stabilization arrays. Highlighted in blue are gametocyte genes frequently detected (95th percentile) in previously published transcriptomic and proteomic analyses (Supplemental Tables S2, S3). Example gametocyte gene markers, pfs16, pfg27/25, pf14.744, adenylate kinase, and mdv1 are noted in red.


