
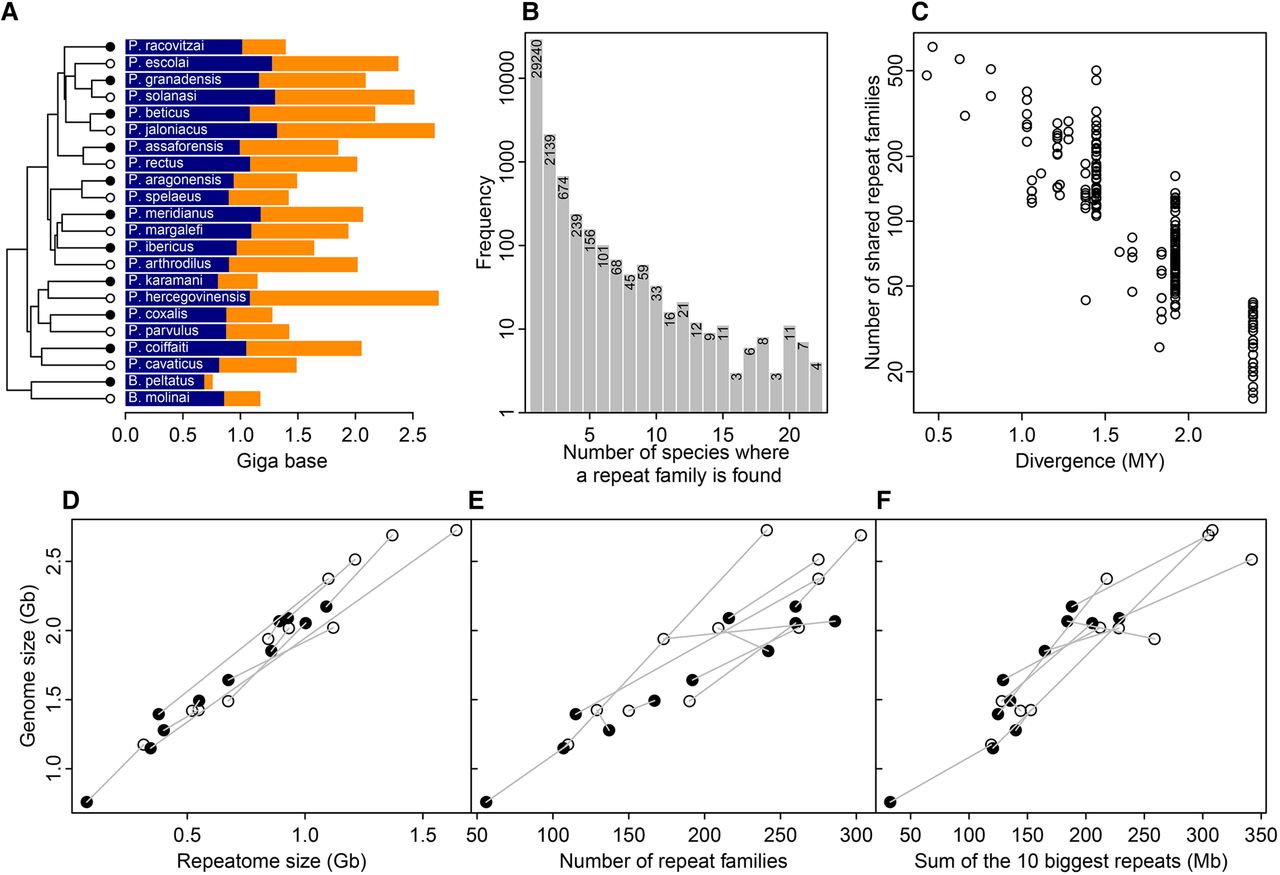
Figure 3.
Repeatome size estimates and composition using low coverage genome sequencing. (A) Size of the non-repetitive genome (blue) and repeatome (orange) for the 22 species (tree symbols as in Figure 1). (B) Repeat family frequency spectrum. (C) Number of shared repeats between two species as a function of divergence time. Relationship between GS and repeatome size (D), the number of repeat families (E), and the total genomic size of the 10 biggest repeat families (F). In D, E, and F, surface (black circles) and subterranean (white circles) species of a pair are joined by a gray line.


