
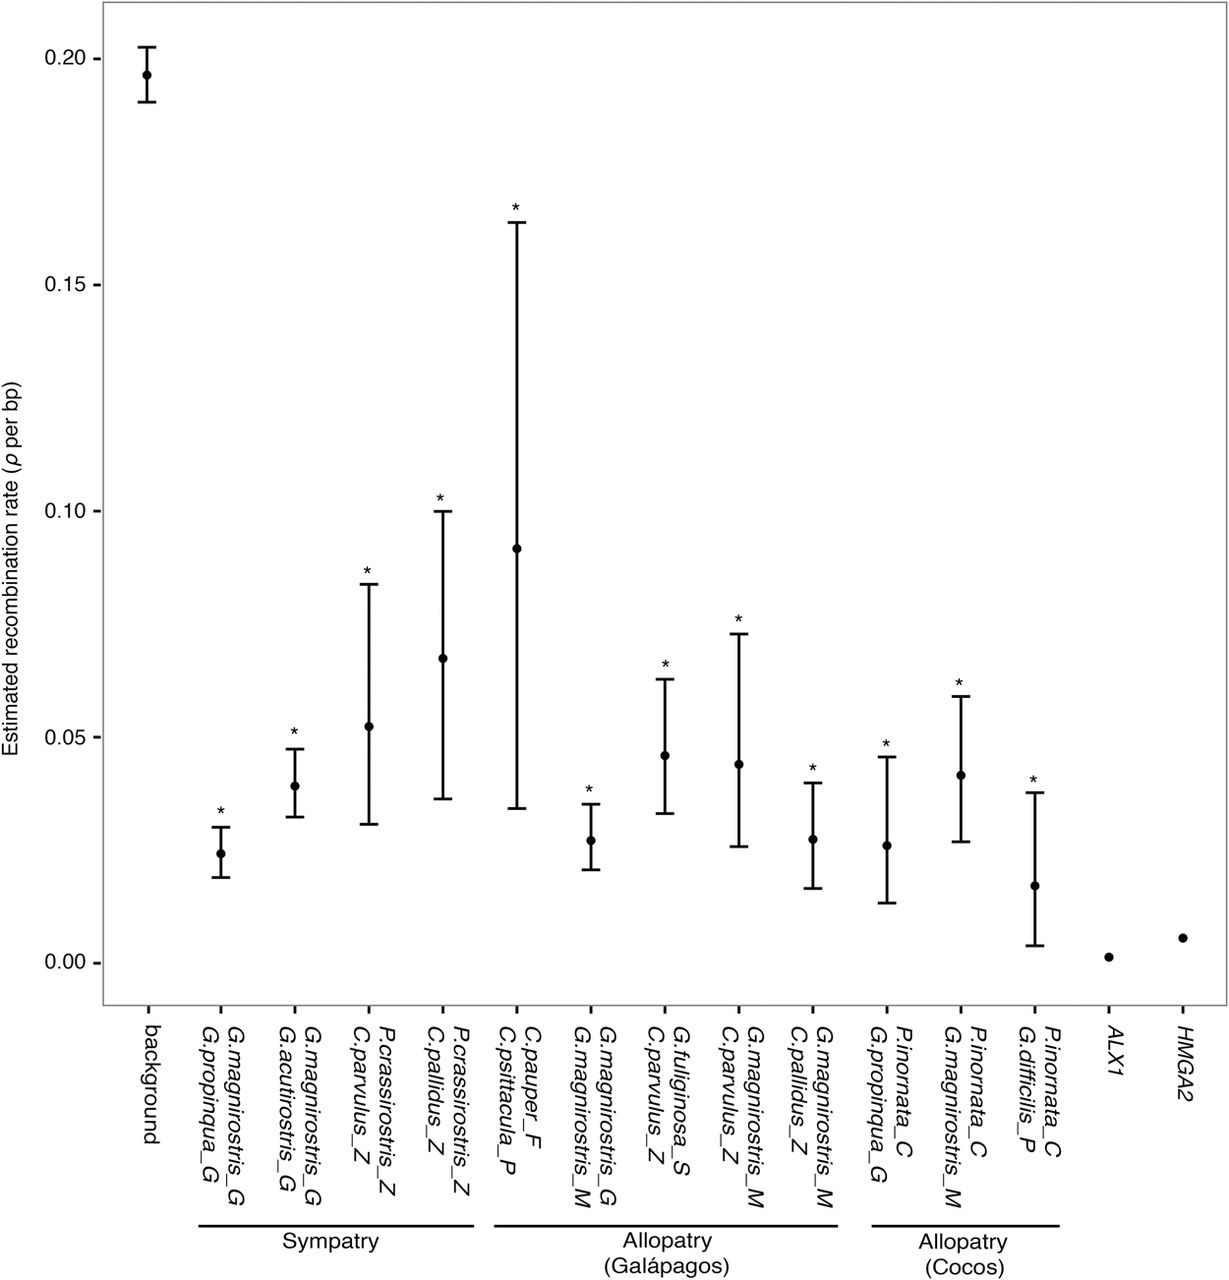
Figure 4.
Estimated recombination rate (ρ) in island regions of each pair and at beak-related loci in comparison to the genomic background. Points refer to the average recombination rate in genomic islands from each species pair or beak-related locus. Upper and lower bounds of each point are the corresponding 95% confidence interval from bootstrapped resamples of each species pair. Significance is tested with a randomization test. (*) P < 0.05.


