
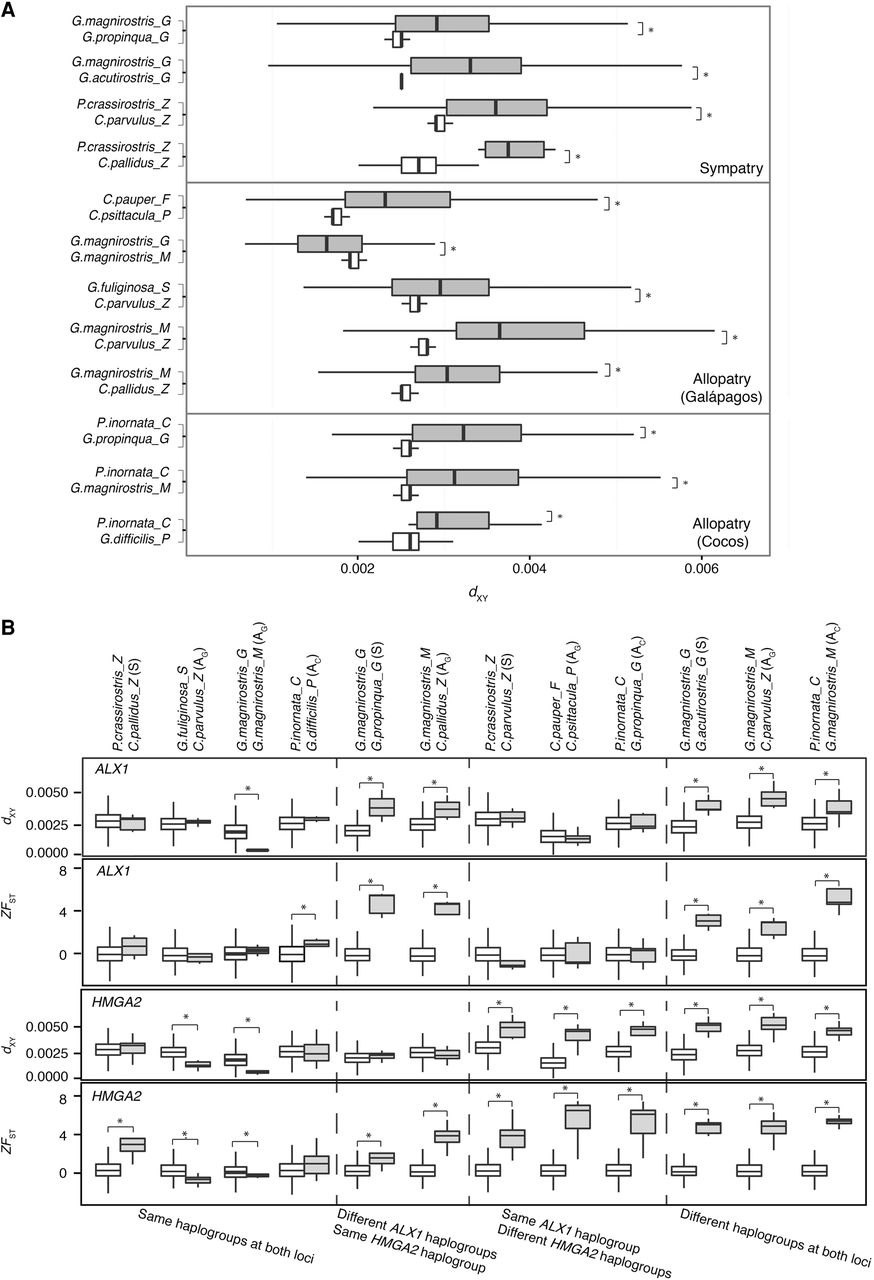
Measures of divergence at genomic islands and beak-related loci among Darwin's finches. (A) Absolute measures of genomic divergence (dXY). Gray boxes represent values in genomic islands and white boxes represent genomic background. Vertical lines from left to right of each box refer to first quartile, median, and third quartile, respectively. The three panels, from top to bottom, are sympatric pairs, allopatric pairs within Galápagos, and allopatric pairs from Cocos Island and Galápagos. Species pairs are sorted by divergence time in each panel. Significance is tested on the basis of a randomization test. (*) P < 0.05. Outliers are not shown in the plot. (B) Relative measures (ZFST) and absolute measures of divergence (dXY) at ALX1 and HMGA2. The four panels, from top to bottom, are dXY at ALX1, ZFST at ALX1, dXY at HMGA2, and ZFST at HMGA2, respectively. Gray boxes represent values in each target locus and white boxes represent genomic background. Horizontal lines from top to bottom of each box refer to first quartile, median, and third quartile, respectively. Abbreviations in parentheses after each species pair refer to geographic distribution: (S) sympatry, (AG) allopatry within Galápagos; (AC) allopatry from Cocos Island and Galápagos. Bottom categories illustrate the haplotype differentiations. Boxes with asterisks indicate that dXY or ZFST is significantly higher than the background, tested with the Wilcoxon rank-sum test. (*) P < 0.05. Outliers are not shown in the plot.


