
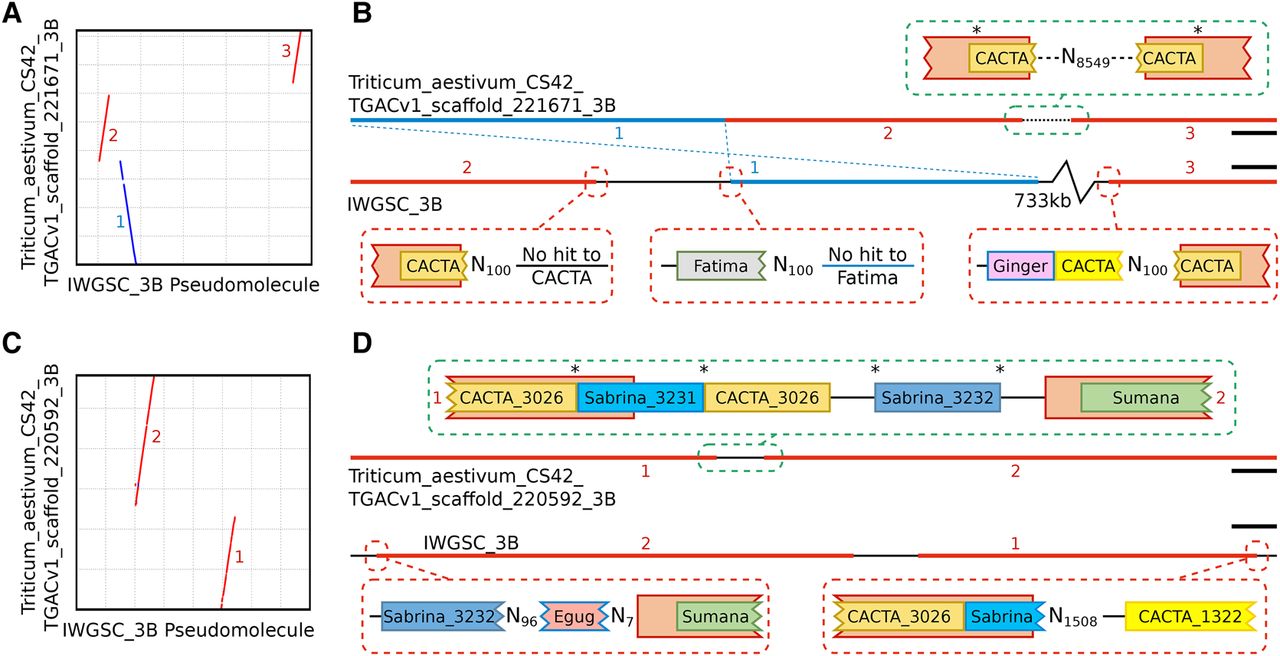
Comparative alignment of TGACv1 scaffolds with the 3B BAC-based pseudomolecule. (A,C) Dot plots between TGACv1 scaffolds and 3B show disruptions in sequence alignment, including rearrangements (red) and inversions (blue). (B,D) Graphical representation of sequence annotations in disrupted regions. Junctions in the TGACv1 scaffolds are consistent with a complete retroelement spanning the junction that includes identical TSD on either side of the retroelement (asterisks). Corresponding regions in the 3B BAC-based pseudomolecule are characterized by Ns that produce inconsistent alignment of retroelements across putative junctions. Retroelements of the same family (CACTA, Sabrina) but matching distinct members in the TREP database are indicated by different colors. Numbers adjacent to sequences correspond to regions shown in panel A and C, respectively. (B) Scale bars, 10 kbp; (D) scale bars, 30 kbp.


