
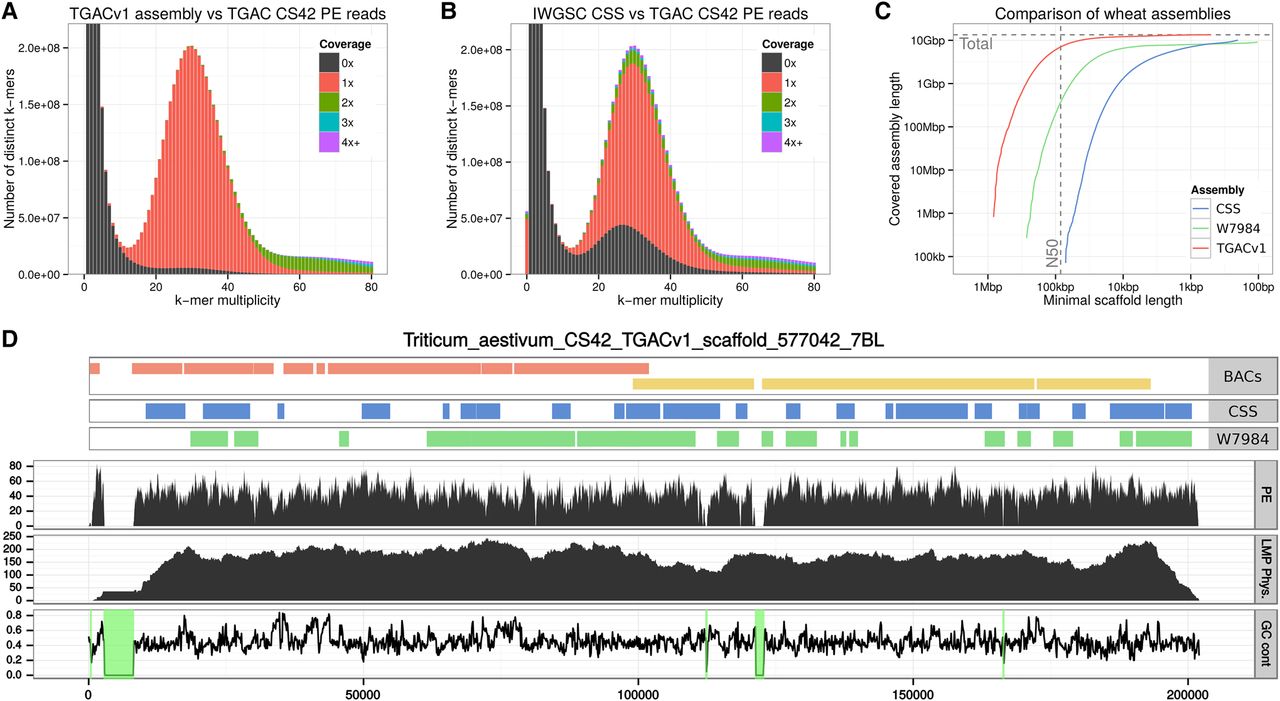
Summary of the TGACv1 wheat genome sequence assembly. (A,B) KAT spectra-cn plots comparing the PE reads to the TGACv1 scaffolds (A) and CSS scaffolds (B). Plots are colored to show how many times fixed length words (k-mers) from the reads appear in the assembly; frequency of occurrence (multiplicity; x-axis) and number of distinct k-mers (y-axis). Black represents k-mers missing from the assembly; red, k-mers that appear once in the assembly; green, twice; etc. Plots were generated using k = 31. The black distribution between k-mer multiplicity 15 and 45 in B represents k-mers that do not appear in the CSS assembly. (C) Comparison of scaffold lengths and total assembly sizes of the TGACv1, W7984, and CSS assemblies. (D) Scaffold 577042 of the TGACv1 assembly. Tracks from top to bottom: aligned BAC contigs, CSS contigs, W7984 contigs, coverage of PE reads, coverage of LMP fragments, and GC content with scaffolded gaps (N stretches) with 0% GC highlighted in green. There are two BACs (composed of seven and four contigs each), 22 CSS contigs, and 15 W7984 contigs across the single TGACv1 scaffold.


