
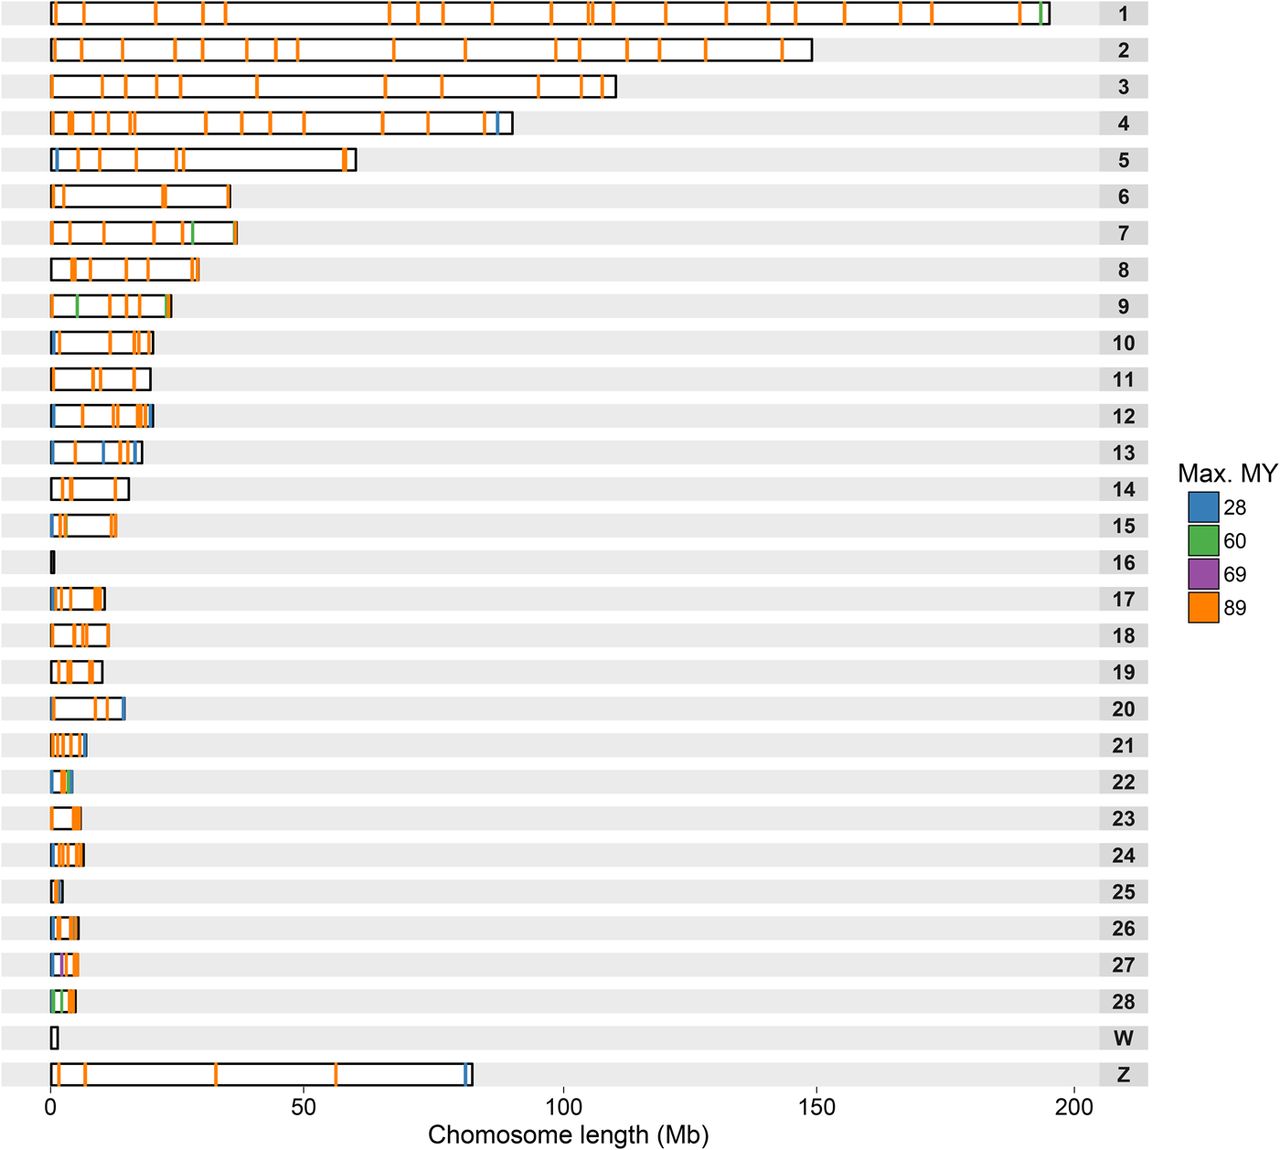
Figure 2.
Distribution of universal BAC clones along chicken chromosomes. Each rectangle represents a chicken chromosome; the lines inside, the location of each BAC clone. BAC clones are colored accordingly to the maximum phylogenetic distance of the species they successfully hybridized. The distribution of spacing between all these BAC clones is shown on the Supplemental Figure S3.


