
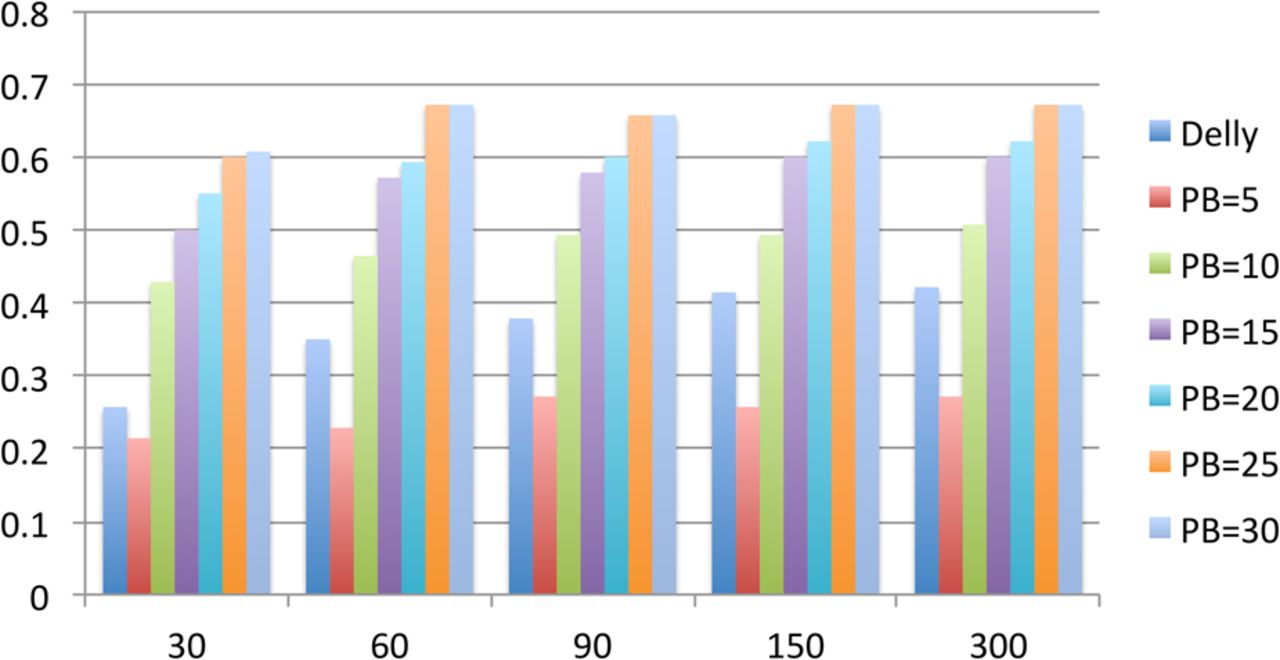
Figure 4.
Coverage analysis. Sensitivities of HySA are estimated at combinations of 5, 10, 15, 20, 25, and 30× PacBio coverage and 30, 60, 90, 150, and 300× Illumina coverage, respectively. Sensitivity of DELLY is also shown on the leftmost bar of each Illumina coverage.


