
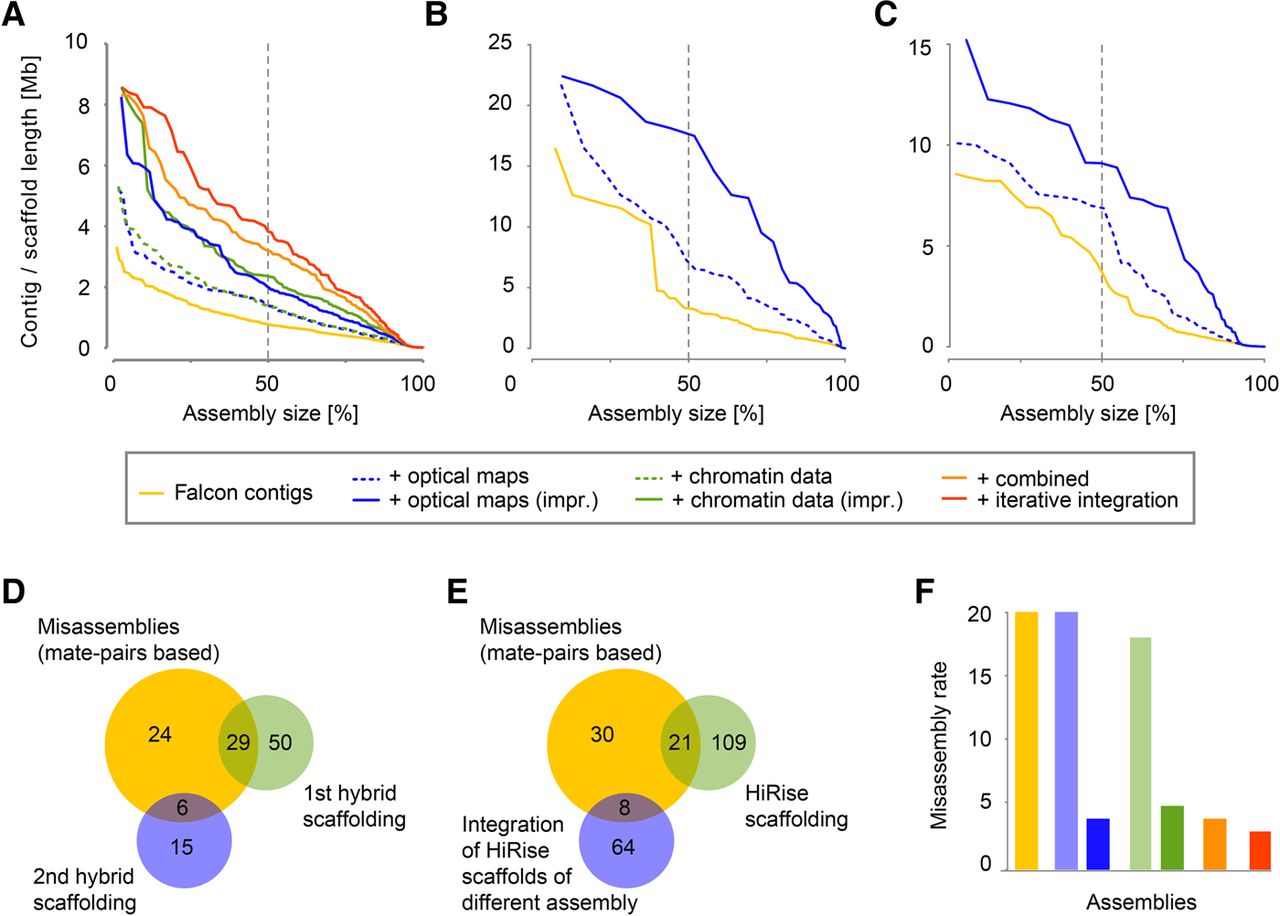
Assembly results and strategies. (A–C) Assembly contiguity of the assemblies of three species: A. alpina (A), E. syriacum (B), C. planisiliqua (C). The x-axis indicates the cumulative length of contigs sorted by length (expressed as percent of the entire assembly). The y-axis shows individual contig or scaffold length. The dashed line indicates the N50/L50 values. (D) Misassemblies identified with Illumina mate-pairs (yellow) and their overlap with breaks introduced during misassembly identification using optical maps (in two steps shown in green and blue). (E) Misassemblies identified with Illumina mate-pair alignments (yellow) and their overlap with breaks introduced during our integration of Dovetail Genomics chromosome conformation capture data (again, two steps shown in green and blue). (F) Inter-chromosome misassemblies identified by a genetic map in each of the assemblies (as shown in A).


