
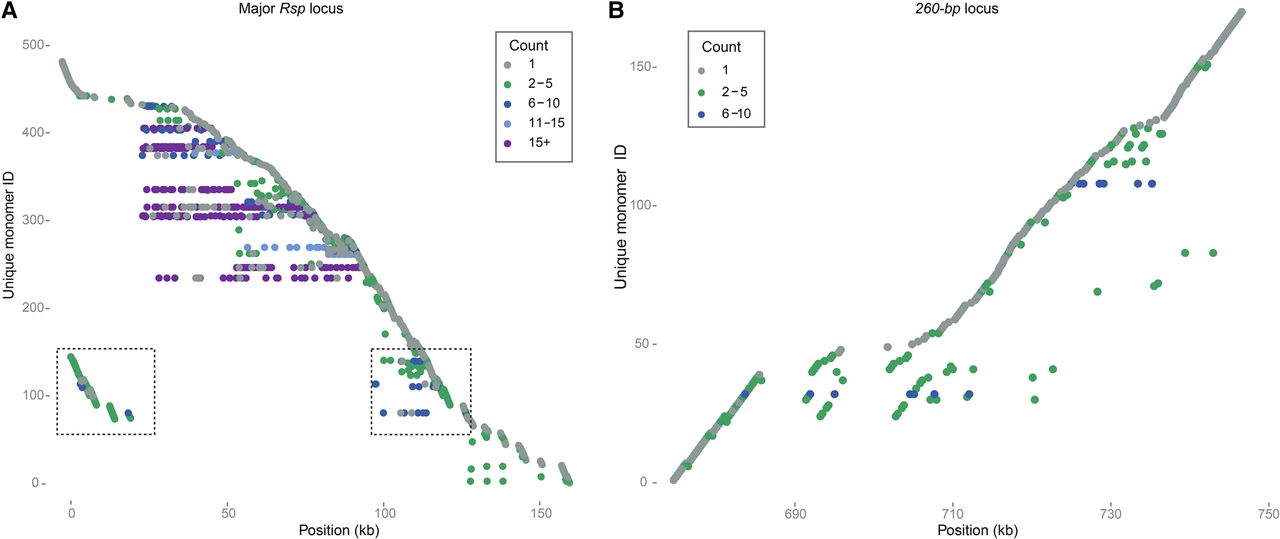
Distribution of satDNA sequence variants across loci. Each row corresponds to a unique monomer, and the x-axis shows the position of that monomer sequence in the array. The color of the point indicates the copy number of each monomer in the array. (A) The Rsp locus on Chromosome 2R. Several high copy number Rsp variants dominate the center of the array (purple and blue), with the low frequency and unique sequences found more toward the proximal and distal ends (gray and green). One cluster of repeats is duplicated on either side of the array (boxed). (B) The 260-bp locus on Chromosome 2L. The majority of repeats occur only once, although a few variants have intermediate copy number.


