
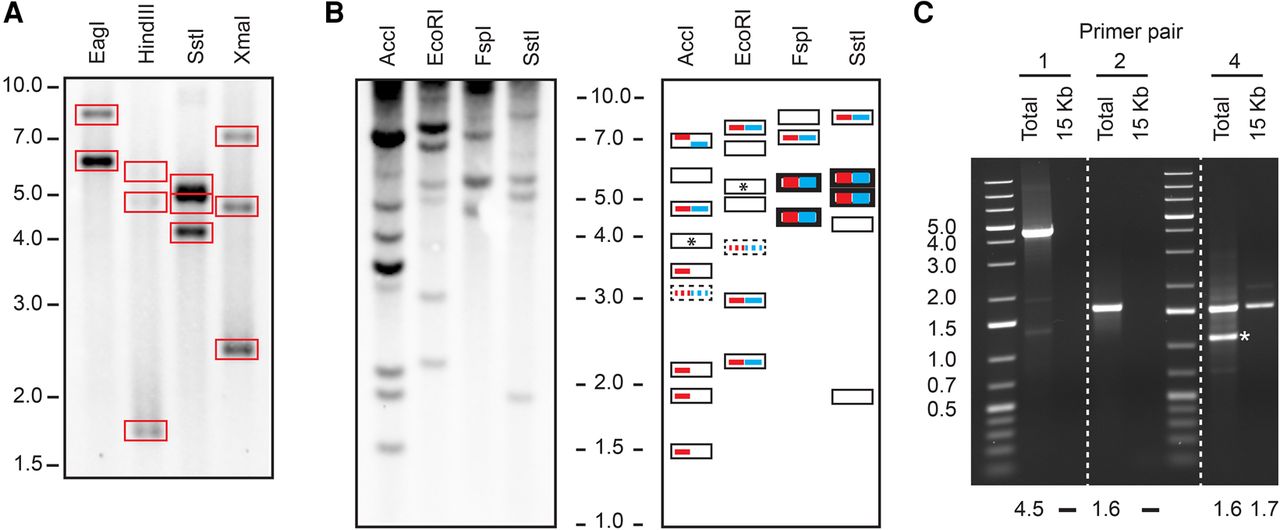
(A) Southern blot of a 15-kb PCR amplicon (primer pair 3) (Fig. 3, see below) from the distal region of the Rsp locus digested with EagI, HindIII, SstI, and XmaI. We detected bands for all predicted fragments (predictions in boxes). The location of the15-kb PCR amplicon and the predicted restriction sites are shown in Supplemental Figure S2. (B) The left side shows a genomic Southern blot used to determine the assembly with the correct Rsp locus organization. Only fragments <10 kb in size were resolved. The right side shows a schematic representation of the results. Fragment sizes consistent with the PBcR-BLASR and BLASR-corr Cel8.3 are indicated with red and blue bars, respectively. Thick bars indicate double bands and dashed bars indicate fragments with few predicted Rsp repeats and thus, a comparatively weak signal. Empty boxes represent detected bands from fragments proximal to the assembled Rsp array and/or partially digested DNA. Boxes with an asterisk represent predicted fragments from Rsp repeats on Chromosome 3L. The actual banding pattern is consistent with the PBcR-BLASR assembly (red). Results from the pulse field gel confirming the overall size of the locus are in Supplemental Figure S2. (C) PCR results confirming the presence of two G5 clusters flanking the major Rsp array (primer pairs 1, 2, and 4). Primer pairs 1 and 2 yield a product for a genomic DNA template and not the 15-kb amplicon; primer pair 4 yields a product for both template types, as expected: (*) a product from elsewhere in the genome. The size (in kb) of the predicted band is below each lane: (–) no predicted product.


