
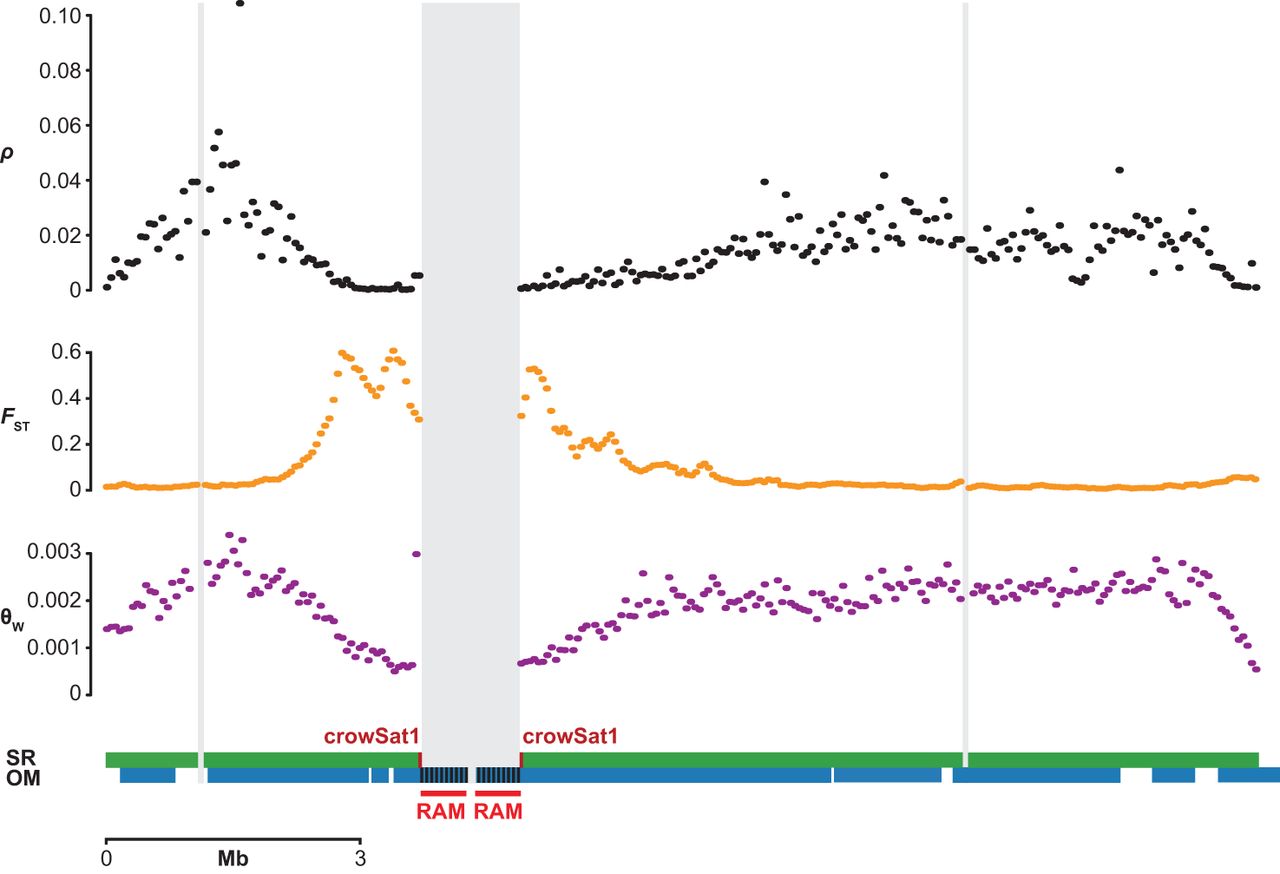
Figure 5.
Structural genome features and population genetic summary statistics surrounding a peak of extreme genetic differentiation between hooded and carrion crows on Chromosome 18. Comparison of population genetic summary statistics ρ/bp, θW, and FST in 50-kb windows: (horizontal green bars) SR assembly with crowSat1 locations in dark red; (horizontal blue bars) OM contigs with RAMs schematically shown with densely spaced nickase motifs; (vertical gray bars) SR scaffold ends.


