
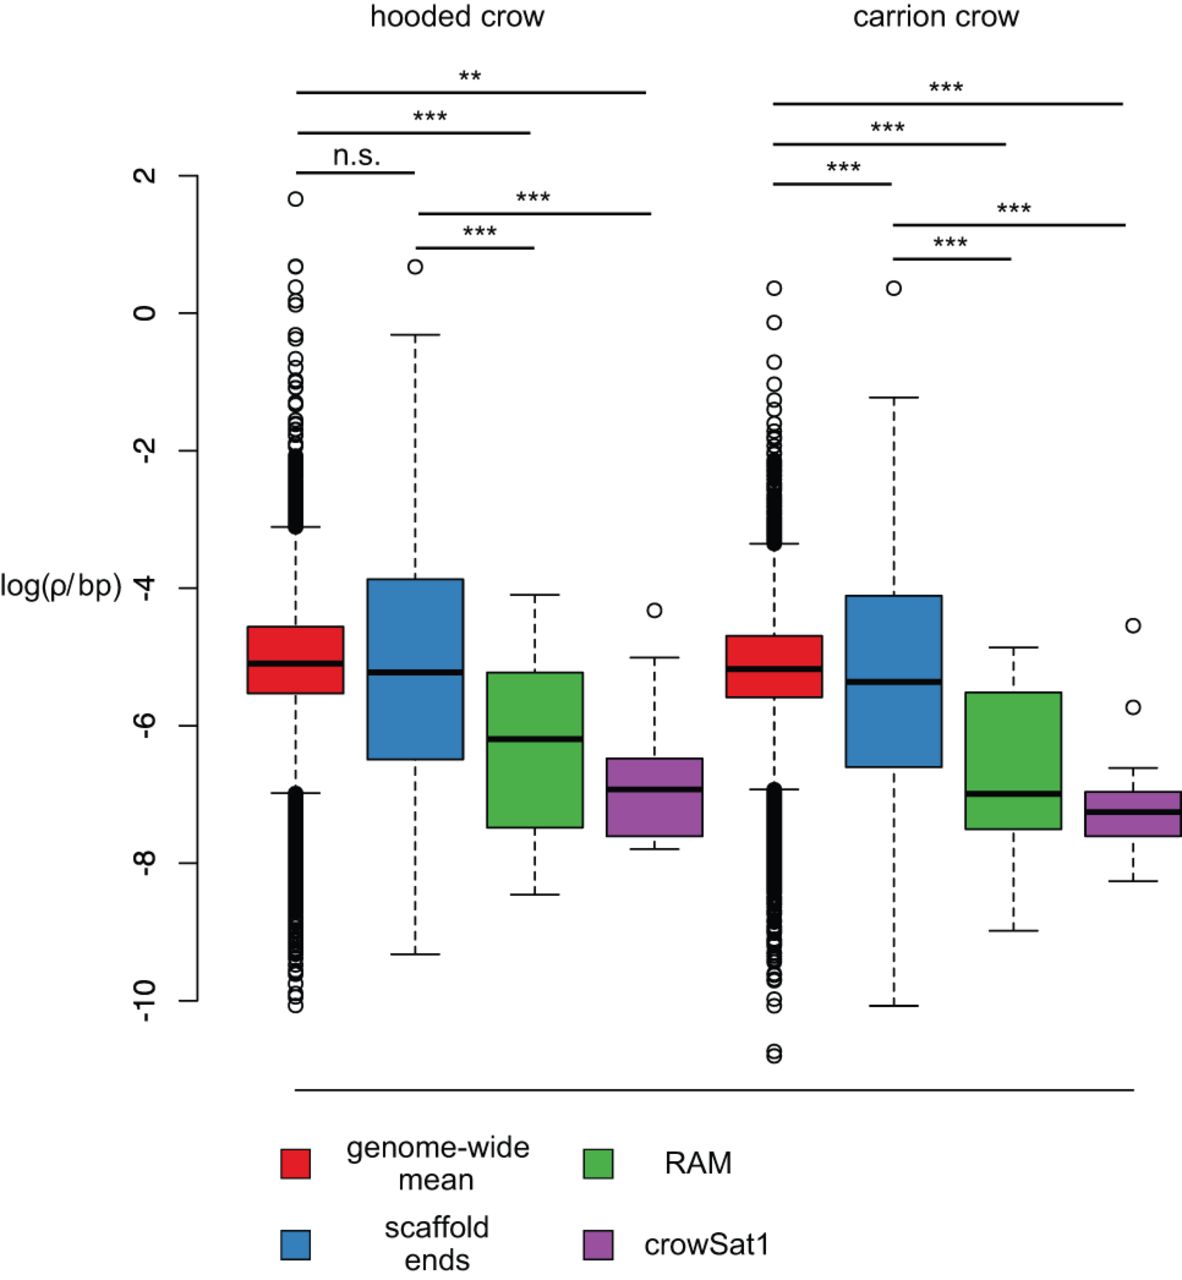
Population-scaled recombination rate ρ as a function of RAMs and crowSat1 satellites. Box plots show loge(ρ) in units of 4Ner/bp as estimated in 50-kb windows for Swedish hooded crow and German carrion crow populations. Values are broken down by category of windows representing the genome (red), windows adjacent to scaffold ends (blue), windows adjacent to RAMs (green), and windows including crowSat1 (violet). Straight horizontal lines depict the median, box margins indicate the interquartile range between 25% and 75% quantiles, and whiskers extend to 1.5-times the interquartile range with values beyond shown as points. Asterisks denote the significance level based on t-tests corrected for multiple comparisons.


