
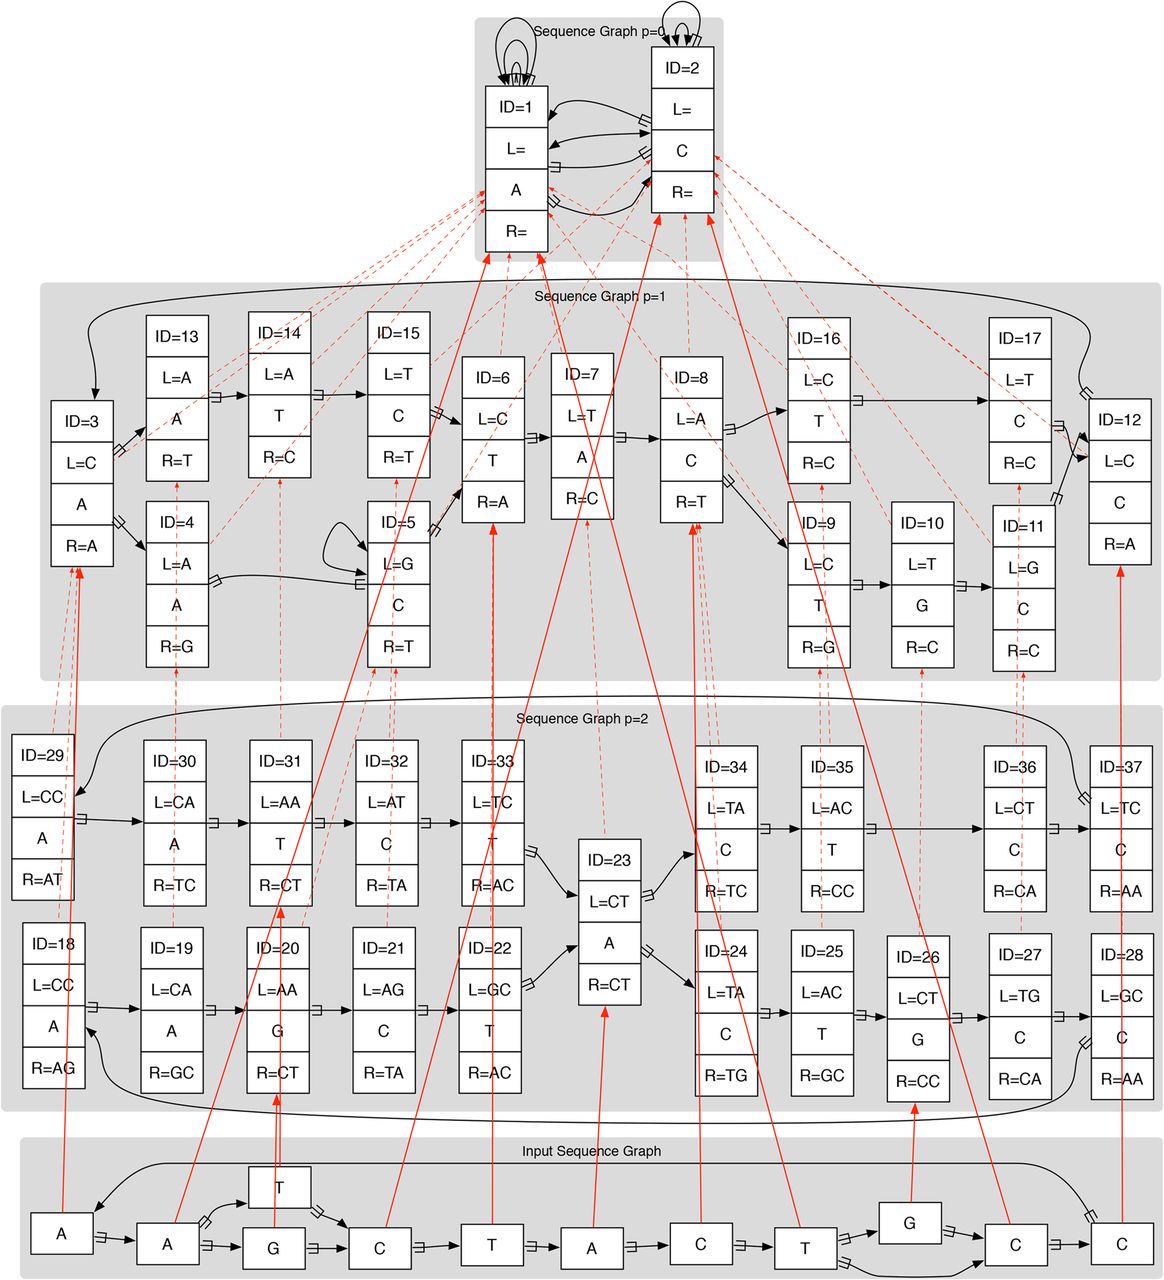
Figure 6.
A reference genome graph hierarchy (most collapsed graph at the top, less collapsed lower), with an input graph (bottom) mapped to it. All the graphs in the reference hierarchy are de Bruijn graphs. Dotted red lines show projections between graphs in the hierarchy, whereas solid red lines show mapping of the input sequence graph into the hierarchy. Here, each node has a unique ID, and the L and R strings represent flanking contexts mapping strings required for unique identification. (Reprinted from Paten et al. 2014, with permission from the author.)


