
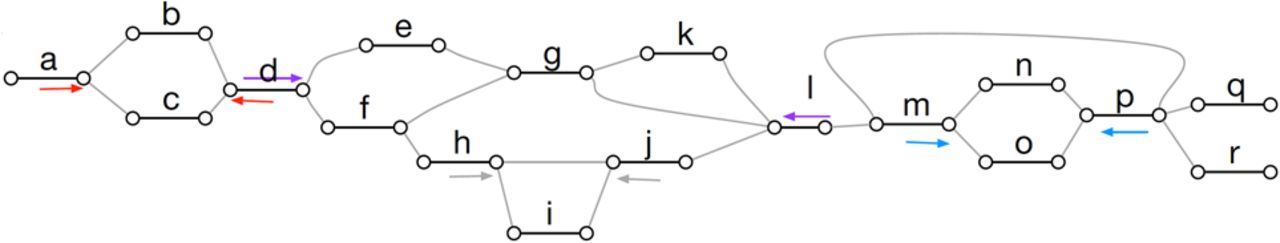
Figure 3.
Ultrabubble sites in a biedged sequence graph. Each arrow shows the terminal node of a site. The color of the arrows indicates the node pairing. Note that the ultrabubble denoted by the gray pair of arrows is nested within the ultrabubble denoted by the purple arrows. (Reprinted from Paten et al. 2017, with permission from the author.)


