
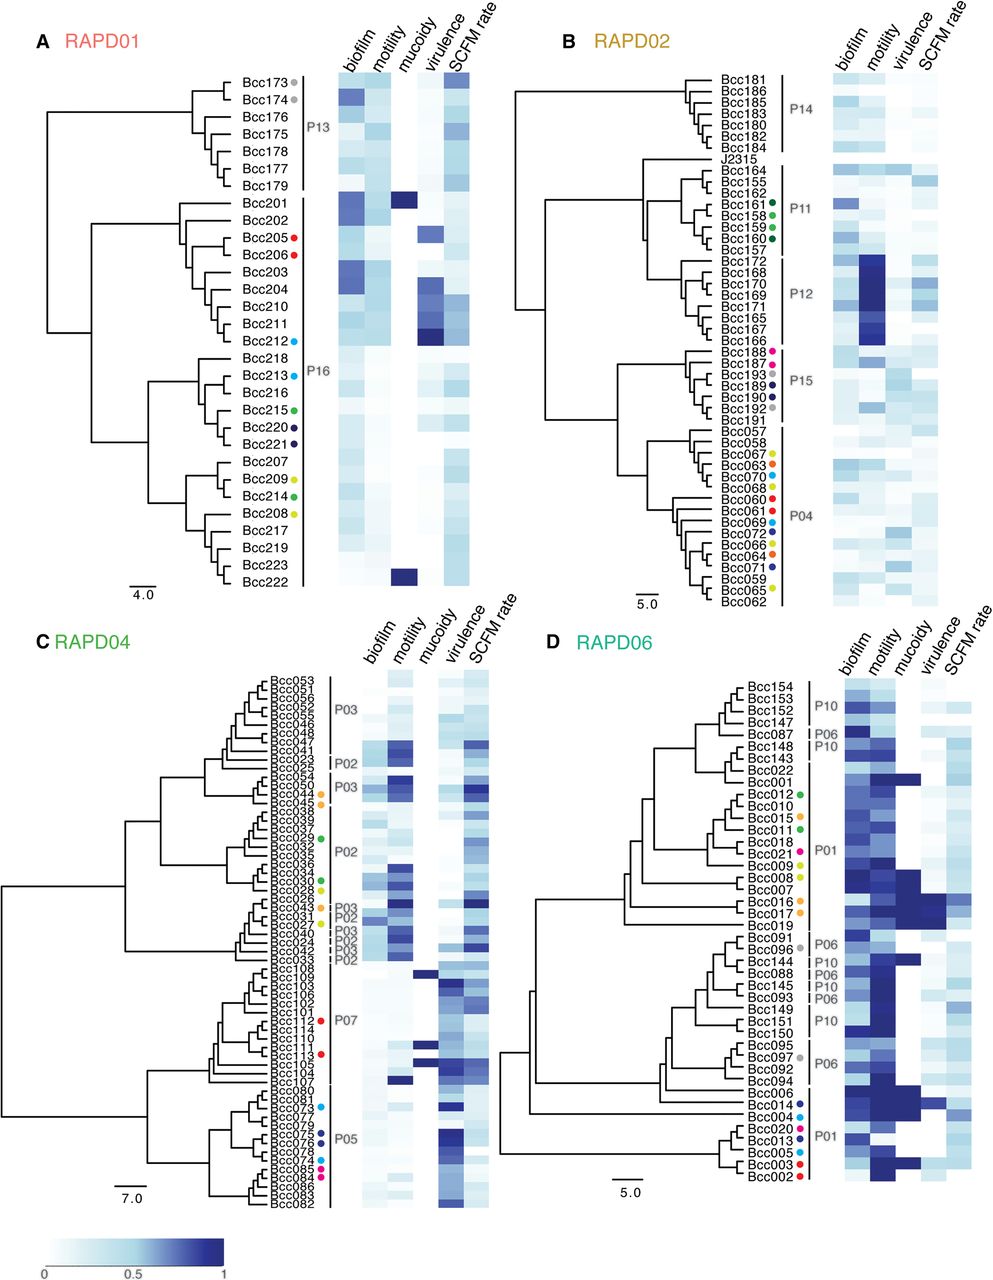
Genetic and phenotypic diversification of B. cenocepacia longitudinal series. Core gene phylogenetic trees were built for each RAPD type, with an adjacent heatmap for each phenotype. Phenotypic data were normalized to range between zero and one (lightest to darkest blue) for each phenotype, based on the range of values measured. Isolates: (A) RAPD01, (B) RAPD02, (C) RAPD04, and (D) RAPD06. Scale bar for the heatmap is on the bottom left, and scale bars for each phylogenetic tree represent the number of SNPs in core genes of the specific RAPD genotypes and the outgroup. Small colored dots are used for the 36 time points for which two to three isolates were collected (78 samples in total), with each color indicating a set of strains isolated from sputum at the same time point from that patient.


