
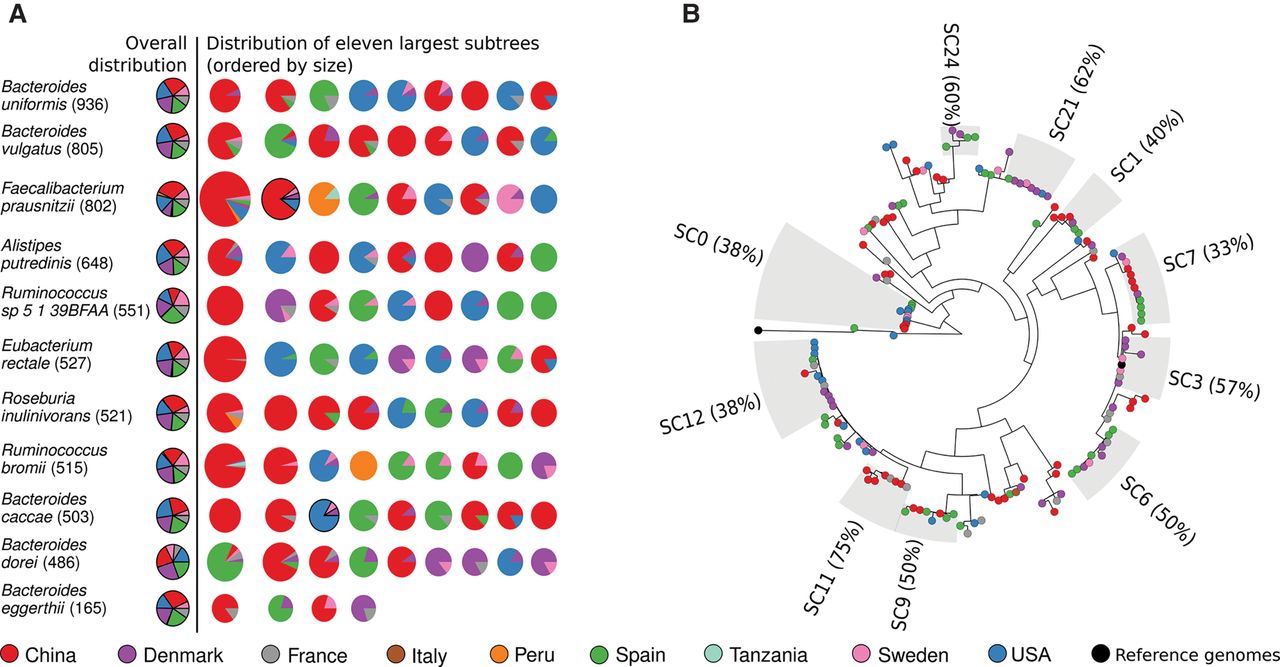
Figure 5.
Associations between subspecies clades and geographical location in the 10 most prevalent gut species and Bacteroides eggerthii. (A) For each of the 10 most prevalent species and Bacteroides eggerthii in this sample set, we show the prevalence of each country in the 11 largest subtrees, ordered by size. Subtrees containing reference isolate genomes are marked with a black border. Information regarding subtrees for all species is available as Supplemental Figures S42–S44. (B) Example phylogenetic tree of Bacteroides eggerthii with the identified subclades.


