
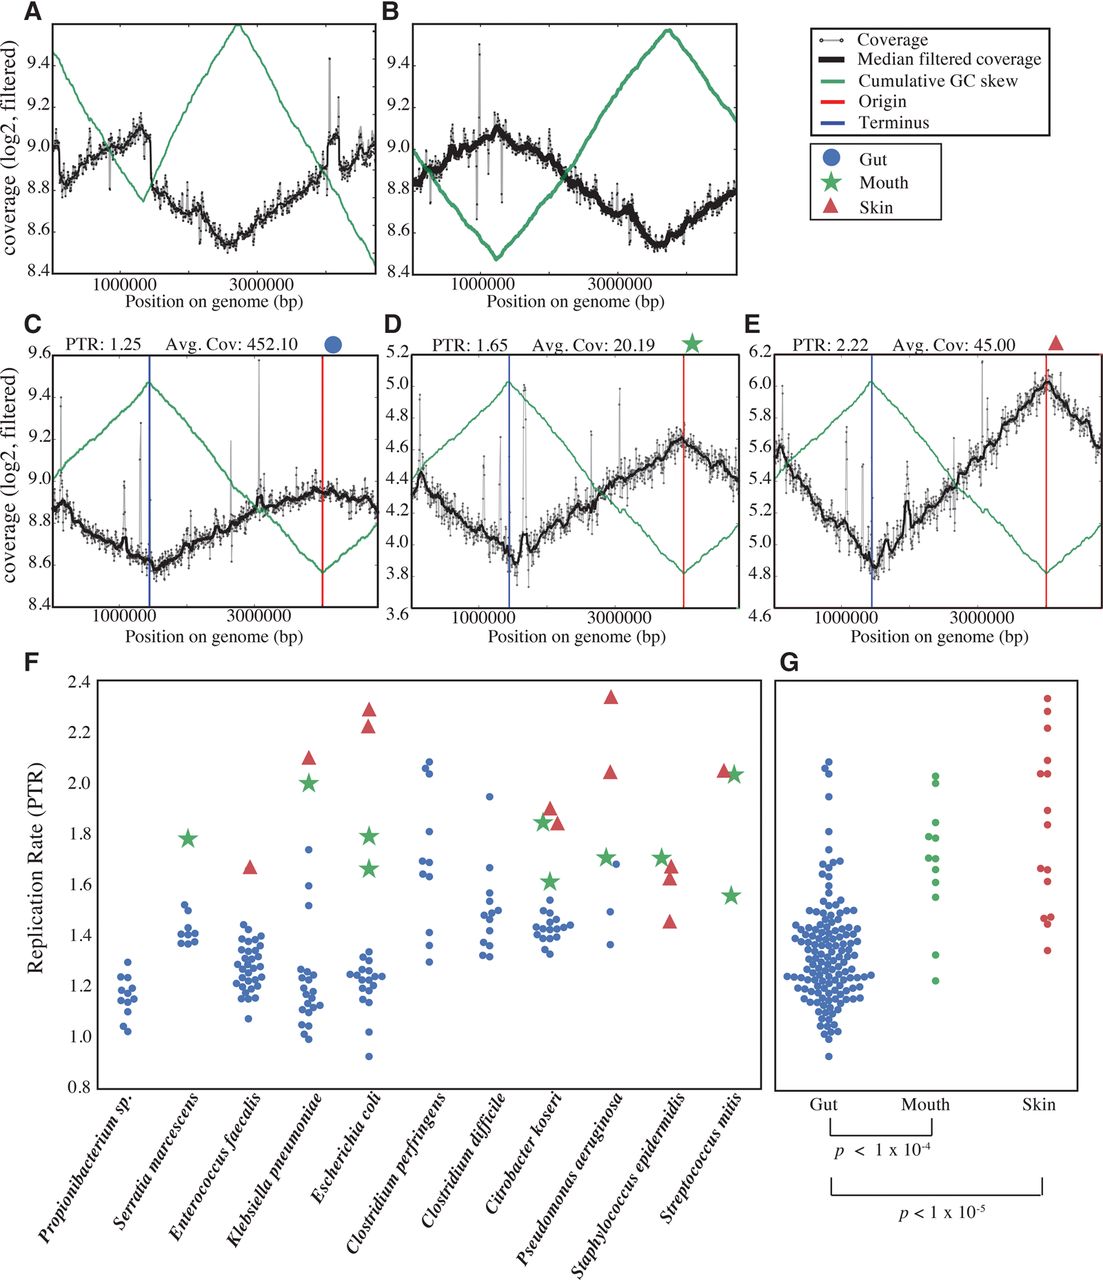
In situ bacterial growth rates are faster in the mouth and skin than the gut. (A,B) Cumulative GC-skew (green line) and coverage (black line) for our reconstructed Citrobacter koseri genome aligned to the RefSeq genome C. koseri strain ATCC BAA-895 (A) and another reference genome (C. koseri strain FDAARGOS_86) (B). Based on the irregularity of trends in the C. koseri strain ATCC BAA-895 plot, we conclude that this genome was improperly assembled at the rRNA operons. Thus, we used C. koseri strain FDAARGOS_86 for ordering and orienting our genome fragments. The ability to uncover assembly errors by inspection of PTR plots underlines the value of these displays. (C–E) Cumulative GC-skew and coverage of our ordered and oriented Escherichia coli genome from Infant 2 using reads mapped from a gut sample (C), mouth sample (D), and skin sample (E). Inspection of the PTR plots ensures that the origin and terminus are determined properly. (F) Aggregate of all peak-to-trough ratio (PTR) measurements for each bacterial species for which at least three measurements were available. In all cases where measurements are available for the same strain growing in multiple body sites, growth is slowest in the gut. (G) Direct comparison of all growth rate measurements for each body site. P-values for Mann-Whitney U test between body sites are shown below.


