
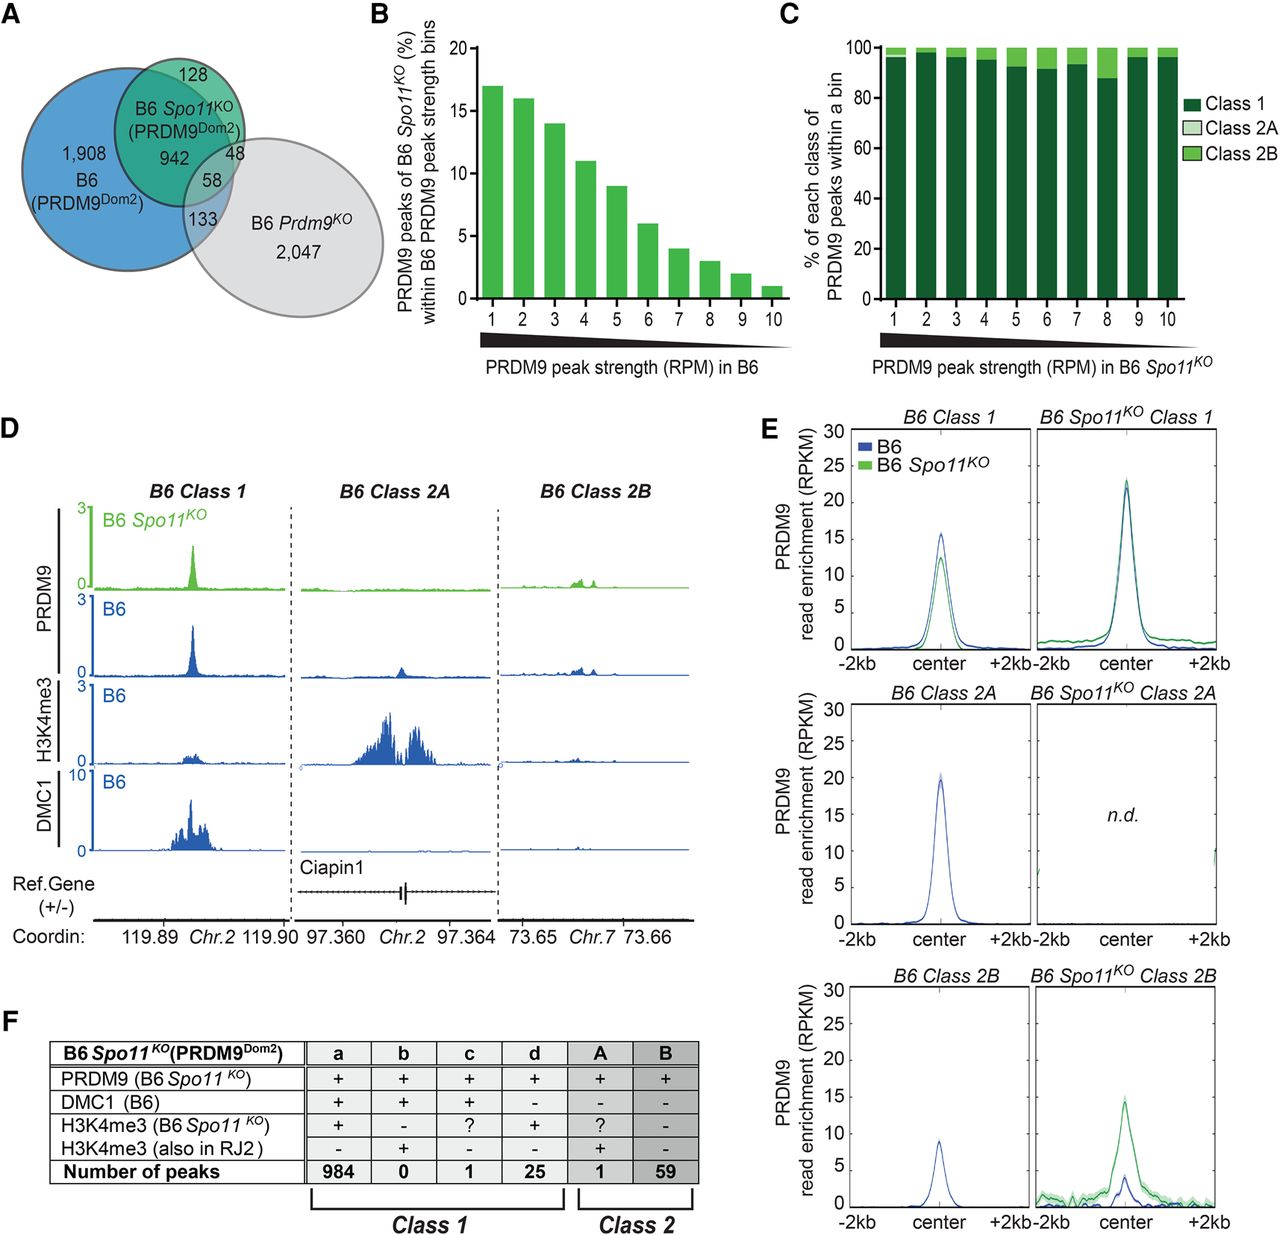
Class 2A, but not class 1 or class 2B, sites are Spo11 dependent. (A) Venn diagram showing the overlap of PRDM9 ChIP-seq peaks from B6 (all 3041 specific and common peaks), B6 Spo11KO (PRDM9Dom2), and B6 Prdm9KO mice. (B) PRDM9 B6 peaks (Spo11+/+) were binned by strength. In each bin, the percentage of B6 Spo11KO (PRDM9Dom2) overlapping peaks was plotted. (C) Distribution of classes into bins of PRDM9 peak strength monitored in B6 Spo11KO mice. (D) Read distribution from PRDM9 ChIP-seq at representative class 1, 2A, and 2B sites found in B6 Spo11KO mice compared with the read distribution from PRDM9, H3K4me3, and DMC1 ChIP-seq in B6 mice at the same sites. Read distribution was calculated from pooled replicates, in 1-bp windows, and normalized by library size and input. (E) Average read enrichment (RPKM) of PRDM9, in B6 and B6 Spo11KO mice centered on class 1, 2A, and 2B sites of each strain. (n.d.) Not determined (only one class 2A peak was identified in B6 Spo11KO). (F) Classification of the PRDM9-positive peaks detected in B6 Spo11KO mice in subclasses with (+) or without (−) enrichment for DMC1 (measured in B6 mice) and/or H3K4me3 (specifically present in B6 Spo11KO mice or also present in RJ2). Classes were defined as in Figure 1D. H3K4me3 ChIP-seq data for B6 Spo11KO (PRDM9Dom2) are from Brick et al. (2012) and downloaded from the GEO database (GSE35498).


