
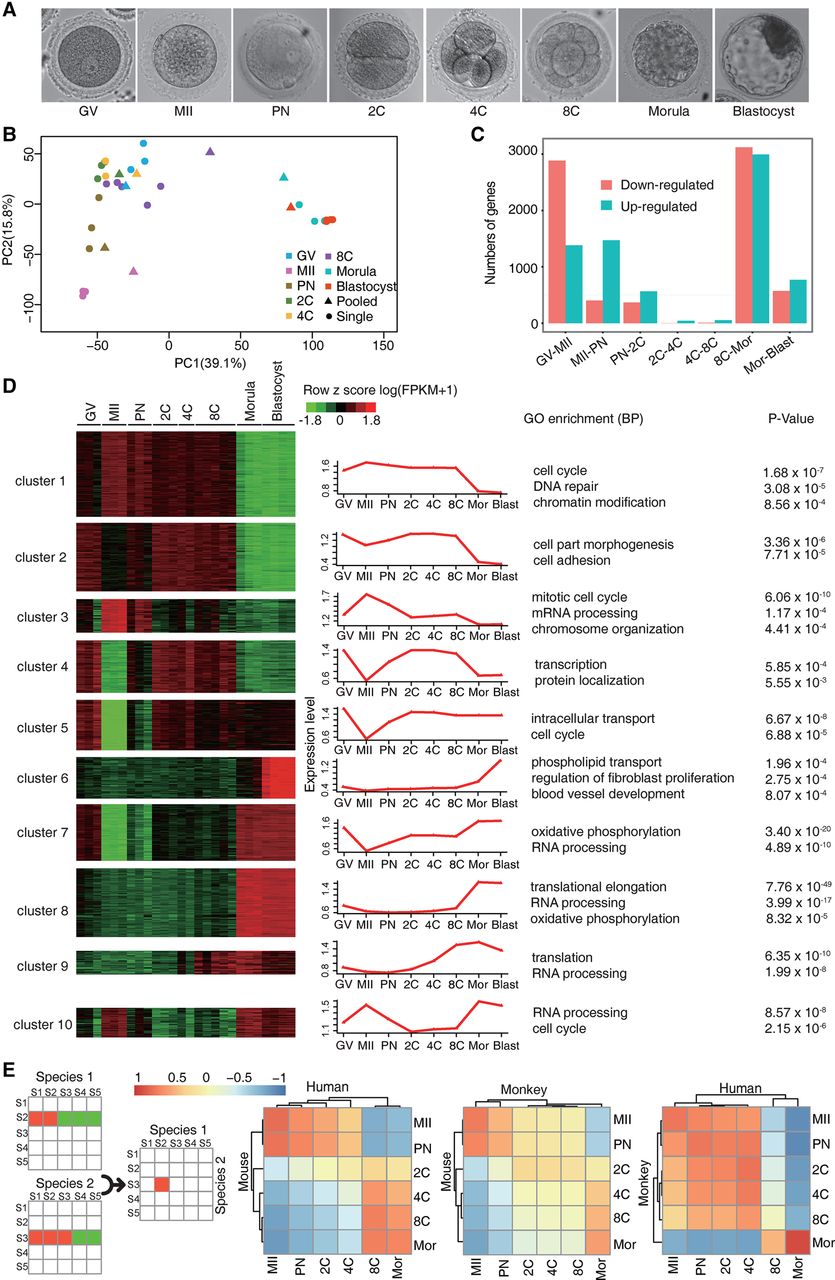
Gene expression profiling of the rhesus monkey oocytes and preimplantation embryos. (A) Brightfield images of the GV oocyte (GV), mature oocyte (MII), one-cell embryo at the pronucleus stage (PN), two-cell embryo (2C), four-cell embryo (4C), eight-cell embryo (8C), morula, and blastocyst. (B) Principal component analysis (PCA) of the transcriptomes of individual- and pooled-oocyte/embryo samples. Two major clusters were identified, suggesting two discrete developmental stages. (C) Histogram showing up- and down-regulated genes between each of the two adjacent stages identified by DESeq2 (FDR < 10−5). (D) DESeq2 identified 6963 differentially expressed genes (DEGs). These DEGs were then clustered into 10 groups by BICSKmeans. Their average log transformed expression values, representative Gene Ontology (GO) terms, and corresponding enrichment P-values are listed. (E) Comparative transcriptome analysis and Pearson correlation coefficient (PCC) between species of pairwise PCCs within each species. (C–E) Based on monkey individual-oocyte/embryo sequencing data. Similar results for the pooled-embryo data are shown in Supplemental Figure S2.


