
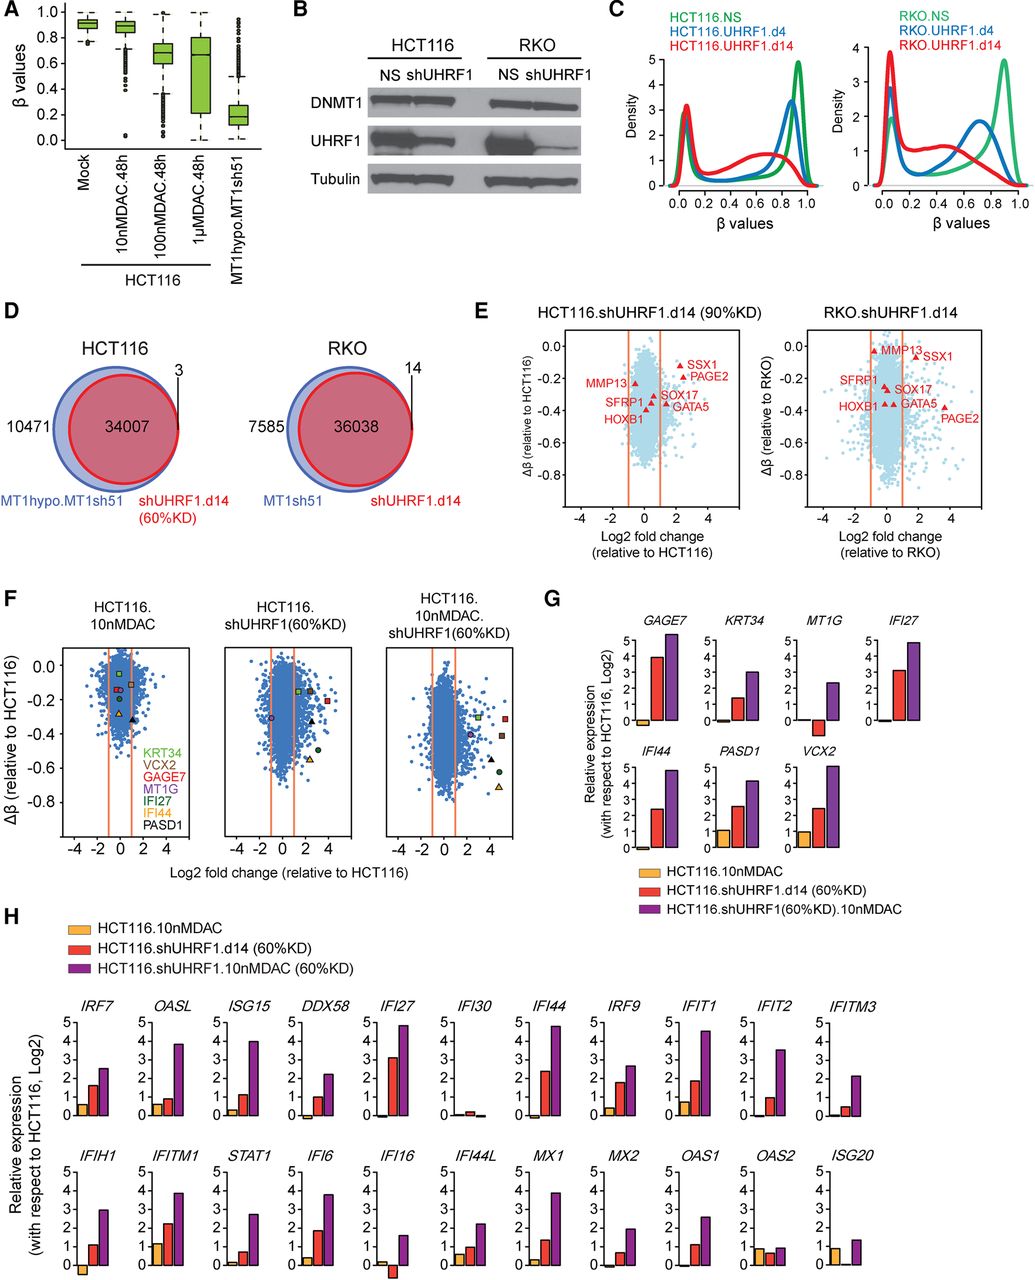
UHRF1 inhibition augments the DNA demethylation effect of low-dose DAC. (A) Whisker box plots for methylation levels (y-axis) of promoter probes in HCT116 cells treated with different concentrations of decitabine (DAC) for 48 h and in HCT116 MT1hypo cells treated with DNMT1 shRNA (sh51) for 12 d. The analysis includes methylated promoter CpGi probes (β values greater ≥0.75) in HCT116 cells. (B) Western blot analysis of UHRF1 and DNMT1 in HCT116 and RKO, with alpha tubulin as loading controls: (NS) nonsilencing shRNA control. (C) Genome-wide DNA methylation profiles at days 4 and 14 following UHRF1 knockdown (β values between 0 and 1; x-axis) versus probability densities that describe the distribution of β values for all probes (y-axis). (D) Venn diagram of Infinium 450K probes demethylated by DNMT1 and UHRF1 knockdowns. The analysis includes promoter probes with β values greater than or equal to 0.75 in HCT116 and RKO cells and that show a decrease of more than 0.2 upon knockdown of DNMT1 or UHRF1. (E) Expression-methylation plots of HCT116 and RKO cells subject to UHRF1 shRNA knockdown (∼90% reduction of UHRF1). The y-axis denotes changes in average β values for individual genes with respect to those in the parental HCT116 or RKO cells. Only genes with hypermethylated promoter (β values ≥0.75) are examined. The x-axis denotes log2 fold changes in gene expression relative to the parental HCT116 or RKO cells. (F) Expression-methylation plots of HCT116 following DAC treatment, 60% UHRF1 knockdown or a combination of both. (G) Quantitated gene expression changes of the seven representative genes marked in F in HCT116 cells following DAC treatment (yellow bars), UHRF1 knockdown (red bars), or a combination of both (purple bars). The y-axis denotes log2 fold changes of gene expression relative to that in the untreated HCT116 cells. (H) Gene expression changes of immune-related, viral defense genes following DAC treatment (yellow bars), UHRF1 knockdown (red bars), or a combination of both (purple bars).


