
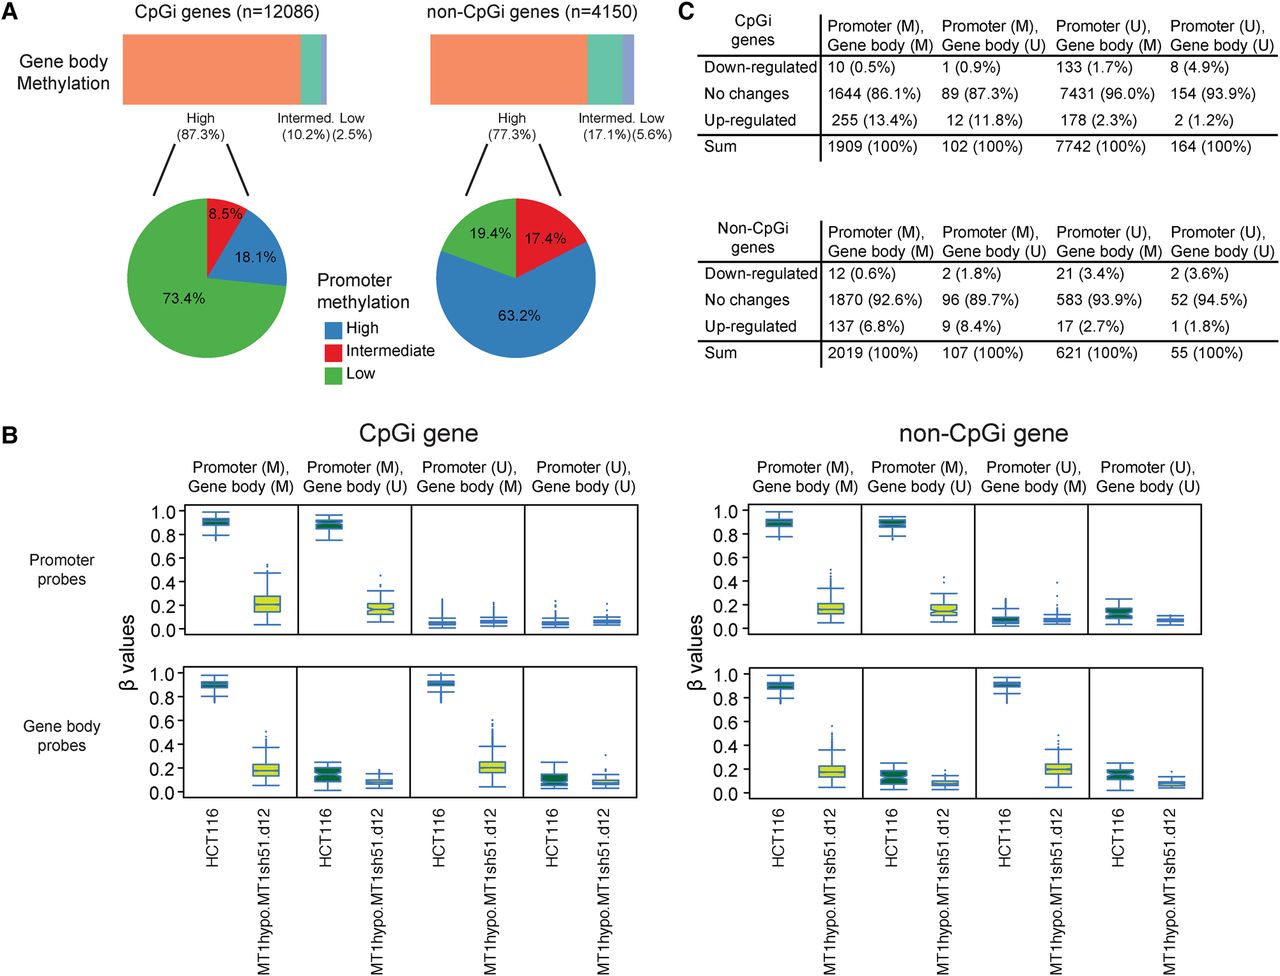
DNMT1 depletion disrupts gene body DNA methylation maintenance. (A) The top bars represent the percentages of gene body probes with different basal DNA methylation values (β ≥ 0.75) of intermediate (0.25 < β < 0.75) and low (β ≤ 0.25) in genes with and without promoter CpG islands (CpGi) in HCT116 cells. The pie charts represent promoter methylation profiles—high (average β ≥ 0.75), intermediate (0.25 < β < 0.75), low (β ≤ 0.25) for genes with high gene body methylation. (B) Box and whisker plots showing methylation level decreases in HCT116 cells with the lowest DNMT1 threshold (β values; y-axis) relative to wild-type HCT116 cells (x-axis designations). Changes in β values of promoter (upper) and gene body (lower) probes before and after DNMT1 depletion are graphed for genes with (left) and without (right) promoter CpG islands, respectively. The analyses include four subgroups of genes in HCT116: (M) methylated = average β ≥ 0.75; (U) unmethylated = average β ≤ 0.25. (C) Numbers (percentages) of genes with expression changes of twofold in HCT116 cells with the lowest DNMT1 threshold comparing to wild-type HCT116 cells. Genes are categorized based on their promoter and gene body methylation status. (M) average β ≥ 0.75; (U) average β ≤ 0.25.


