
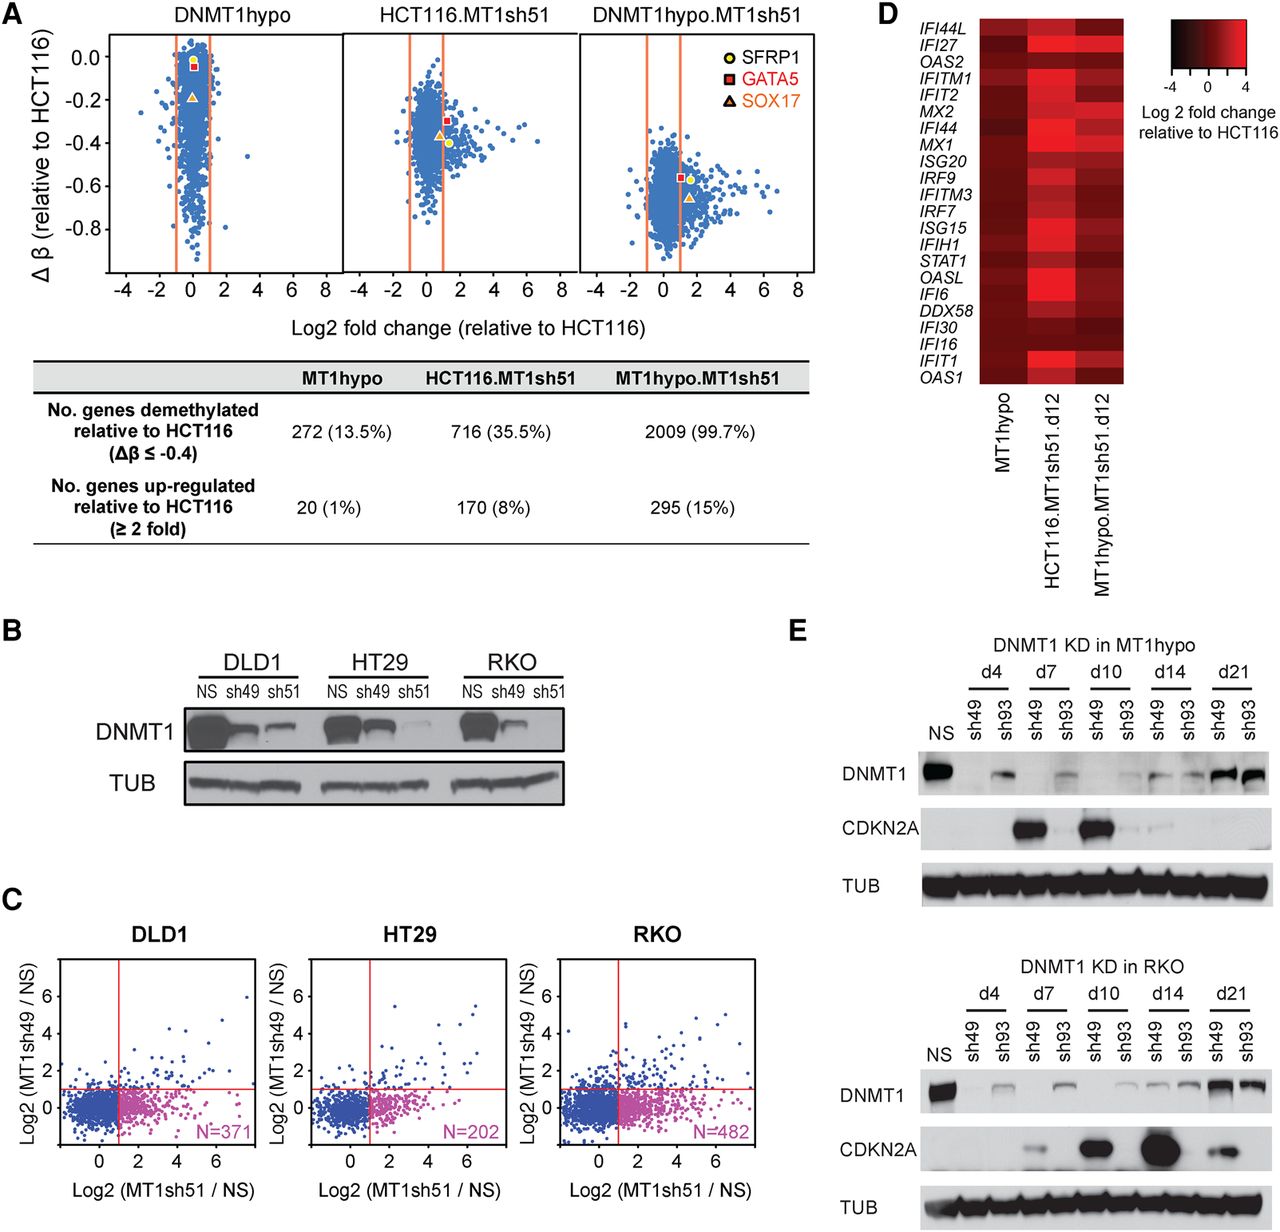
Effects of DNMT1 depletion on gene expression in colon cancer cells. (A) Relationships of gene expression to DNA methylation in HCT116 cells with decreasing DNMT1 protein levels. The y-axis denotes changes in average β values for individual genes with respect to those in the wild-type HCT116 cells. Only genes with hypermethylated promoter CpG islands (β values ≥0.75) in HCT116 cells are shown. The x-axis denotes log2 fold changes in gene expression relative to the wild-type HCT116 cells. Numbers of demethylated and up-regulated genes are summarized in the lower table. Three known tumor suppressor genes—SFRP1, GATA5 and SOX17—are marked in the plot. (B) Western blot analysis of DNMT1 in colorectal cancer cell lines, DLD1, HT29, and RKO, following DNMT1 knockdown using shRNAs of higher (sh51) and lower (sh49) efficiencies: (NS) nonsilencing shRNA control; (TUB) alpha tubulin. (C) Genome-wide gene expression analyses of genes with promoter CpG island methylation in cell lines shown in B, subject to DNMT1 knockdowns. Genes with hypermethylated promoter CpG islands (β values ≥0.75) in the parental lines are included in the analysis for each cell line. The x-axis denotes relative gene expression change (log2 fold change of sh51 treatment/control) of the hypermethylated genes. The y-axis denotes log2 fold change of sh49 treatment/control of the hypermethylated genes. (D) Heatmap of log2 fold expression changes for viral defense genes (y-axis; see text for details of genes) in wild-type HCT116 or MT1hypo cells treated with DNMT1 shRNA51 for 12 d. (E) Western blot analysis of CDKN2A and DNMT1 in HCT116 MT1hypo cells (upper) and RKO cells (lower) at different time points following DNMT1 knockdown using shRNAs of higher (sh49) and lower (sh93) efficiencies: (NS) nonsilencing shRNA control.


