
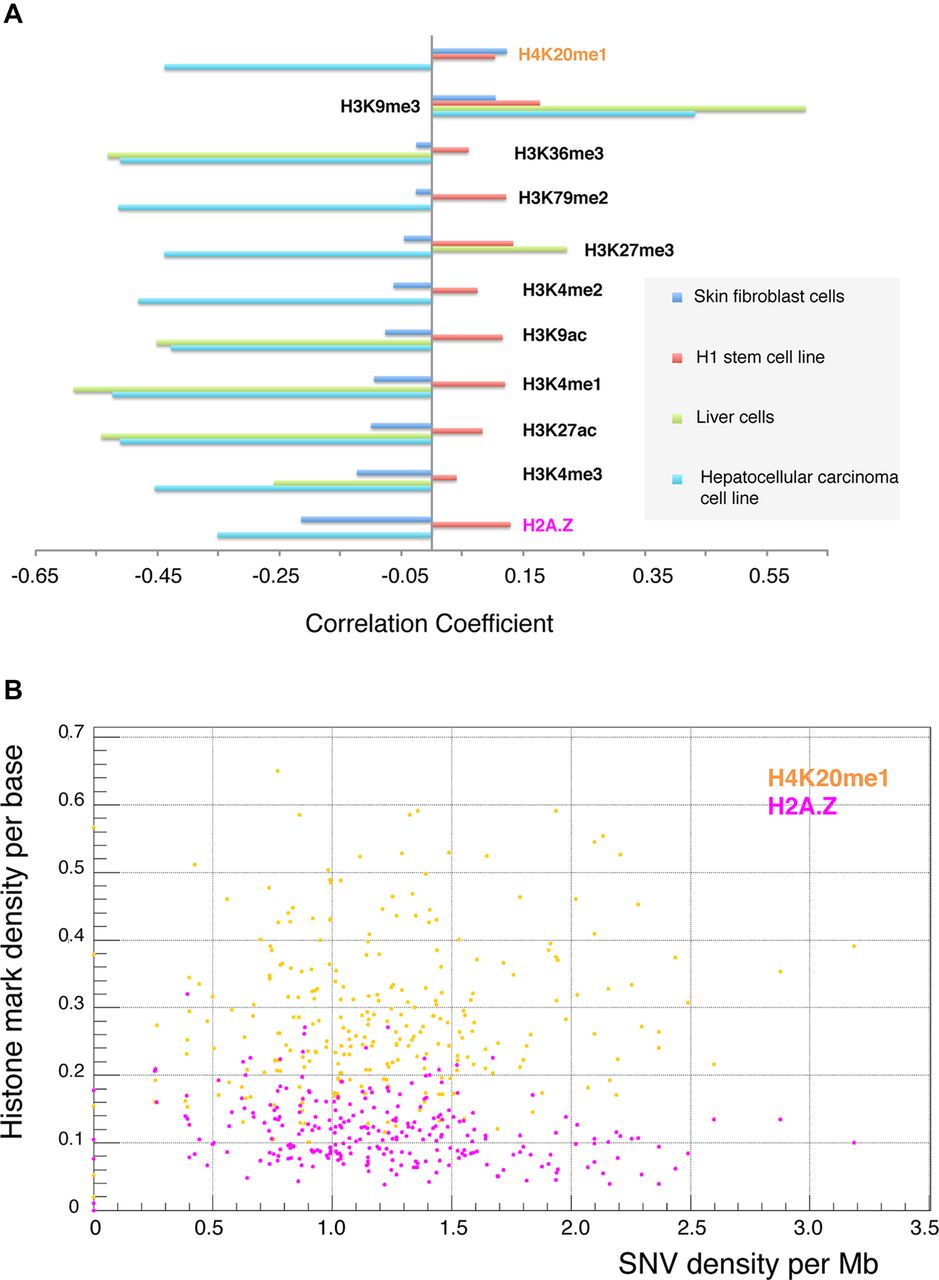
(A) Mosaic SNVs in fibroblasts (detected in this study) exhibit negative correlations (except for the H4K20me1 mark) with histone marks from skin fibroblasts (blue bars). This is similar to what was observed for somatic SNVs in liver cancer (external data set) with histone marks from hepatocytes (green) and hepatocellular carcinoma cell line (cyan). However, the absolute values of correlations are lower. Data for certain histone marks are not available, and the corresponding bars are not shown. In contrast, mosaic SNVs in fibroblasts correlate positively with histone marks in stem cells. Correlations for the H1 cell line are shown in red (see also Supplemental Fig. S9). (B) Example of correlation between density of mosaic SNVs in fibroblasts and two histone marks in fibroblasts.


