
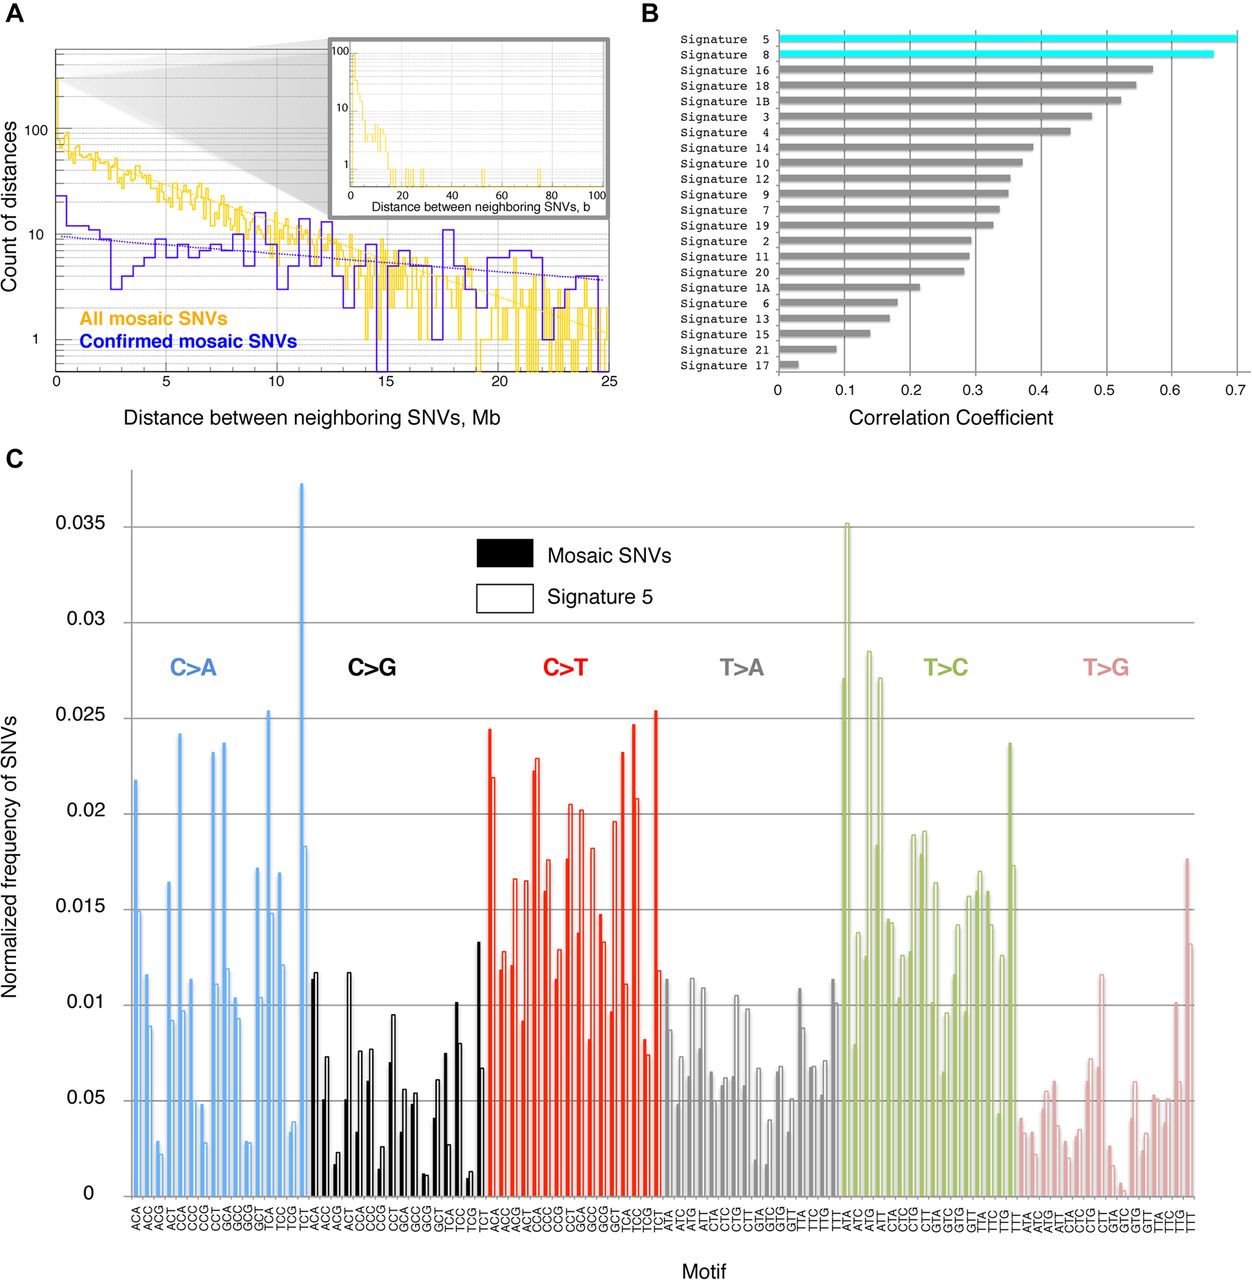
(A) On a large scale, the distance between neighboring SNVs is distributed according to the power law, i.e., frequency decreases exponentially with increasing distance. This is consistent with a uniform distribution of SNVs across the genome (such simulated distributions are shown by dashed lines). There is an enrichment of short (i.e., <20 bp) distances (see inset). All data pertain to four children. (B) Distribution of trinucleotide motifs of the reference genome around SNVs defines mutational signature. The signature of mosaic SNVs is similar to signature 5 and signature 8 observed in cancers (Alexandrov et al. 2013). (C) Comparison of mutational signature in this study (solid bars) with signature 5 from cancers (empty bars).


