
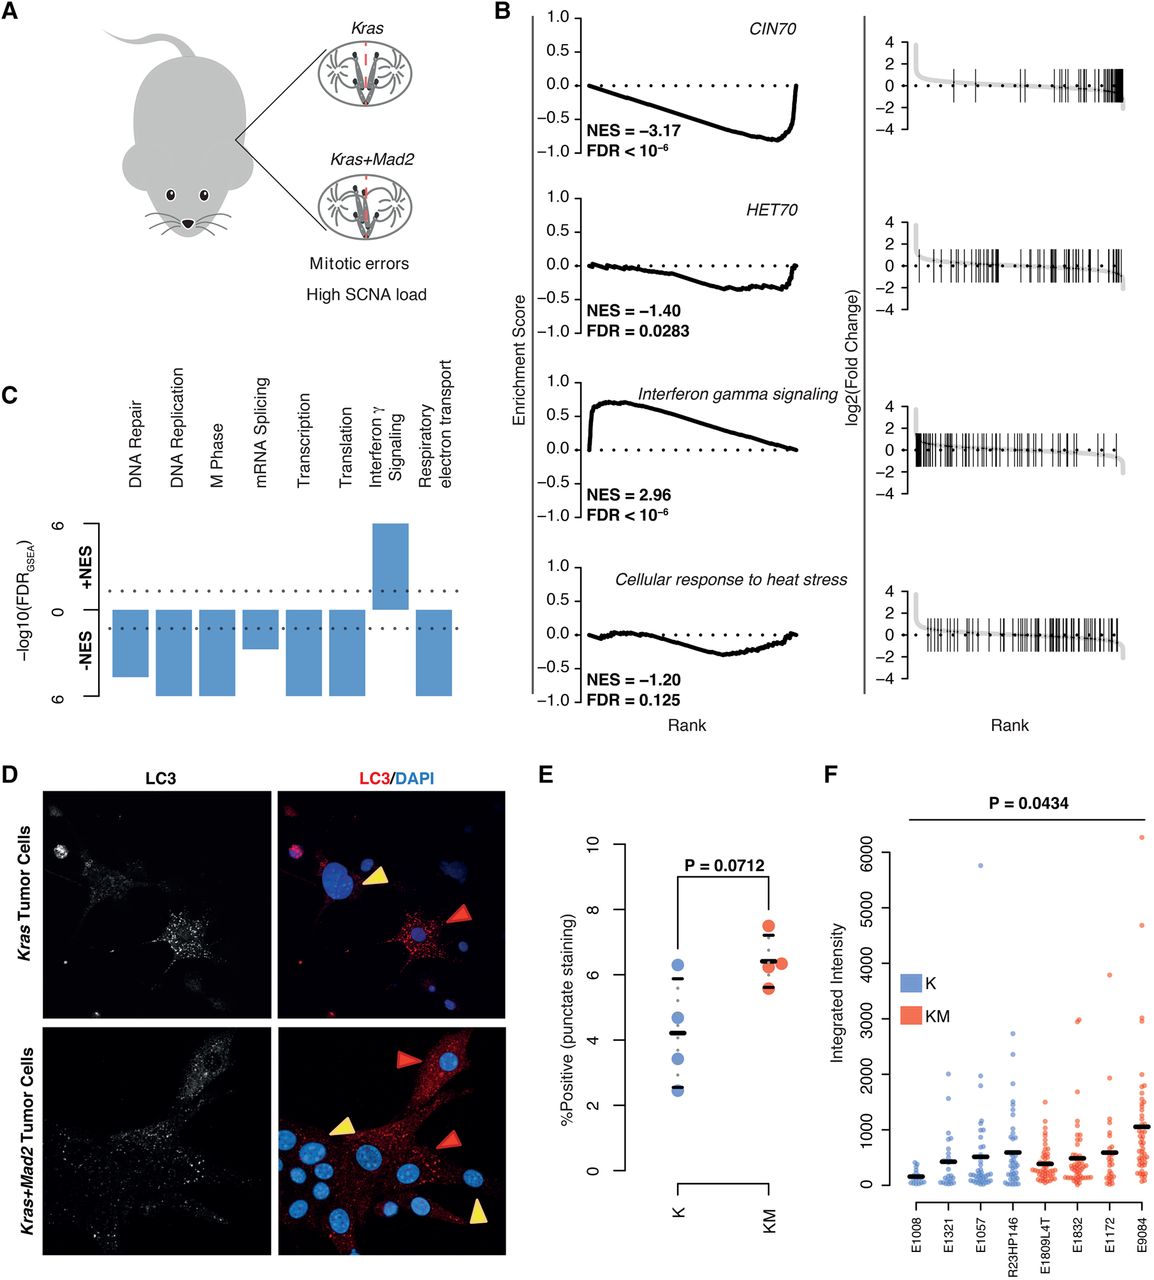
Gene set enrichment analysis of transcriptional changes between Kras-Mad2l1 and Kras breast tumors. (A) Descriptive image of mouse model. (B) GSEA plots of select gene sets. (Left) Running-sum plots with running sum on y-axis and gene rank based on fold change on x-axis. (Right) Ranked fold changes with gene-set members denoted by shaded lines. Normalized enrichment scores (NESs) and FDRs are displayed in the plot. (C) Overview of GSEA results for breast KM versus K models. −log10-transformed FDRs are displayed on the y-axis with directionality denoting the direction of the enrichment. (D) Representative images of cultured tumor cells taken ex vivo for analyses for LC3 staining. Red arrows mark positive and yellow arrows mark negative cells. (E) Comparison of average percentages of cells staining positive for LC3 in K versus KM cells. P-value calculated using Student's t-test. (F) Comparison of LC3 staining intensities in positive staining cells between K and KM cells. P-value calculated using a linear mixed model ANOVA for the effect of genotype on observed staining intensity. At least 18 cells per tumor were used.


