
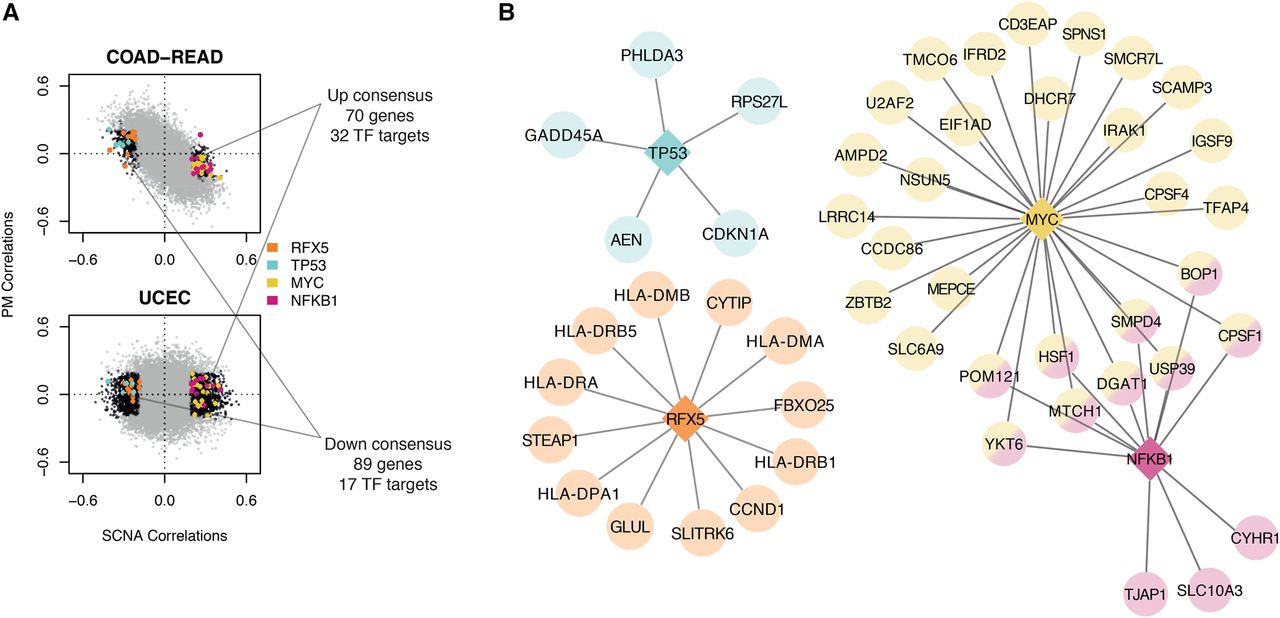
Figure 4.
Comparison of gene signatures present in UCEC and COAD-READ. (A) Correlation distributions of COAD-READ and UCEC. Black dots represent FDRSCNA < 5% and FDRPM > 5%. Colored dots represent regulated genes predicted by iRegulon (corresponding transcription factors in legend). Text describes overlap between negative (down consensus) and positive (up consensus) correlating sets. (B) Predicted transcriptional networks based on iRegulon. Circular nodes represent target genes, with predicted regulators denoted by diamonds.


