
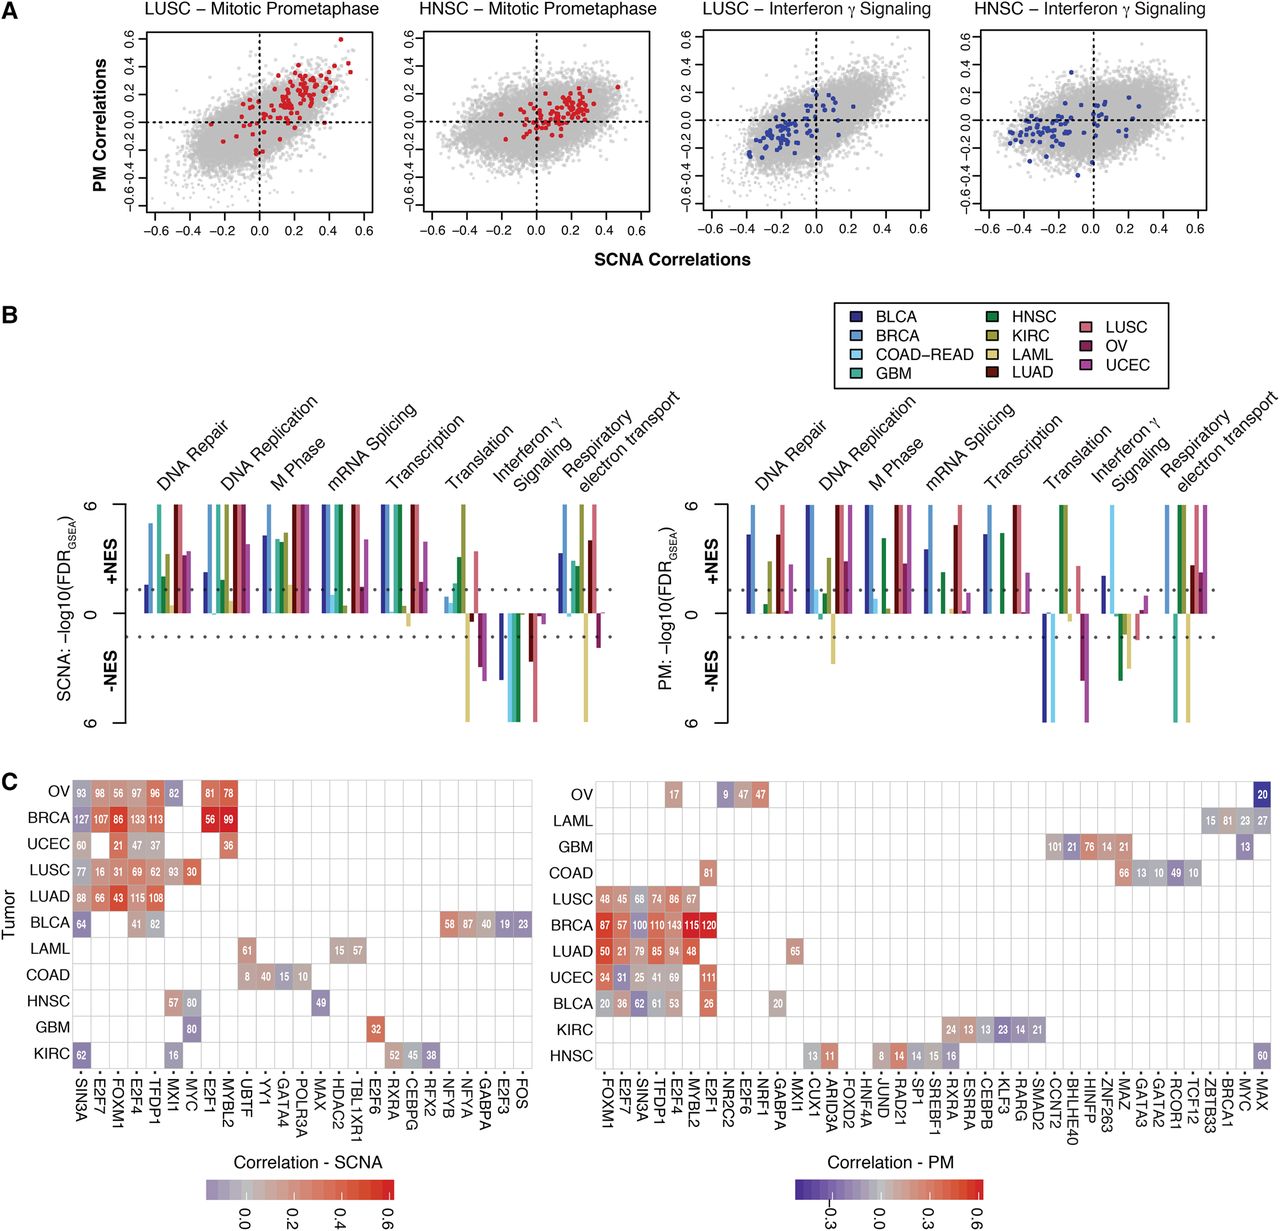
Pathway and transcriptional regulation prediction analyses of genes associated with PM and SCNA burden. (A) Examples of 2D gene set enrichment analyses (GSEA). Genes from sample Reactome gene sets are superimposed on HNSC and LUSC correlation plots. (B) GSEA across 11 tumor types. −log10-transformed FDRs are displayed on the y-axis with directionality denoting the direction of the enrichment. Colors denote tumor types described in the legend. (Left panel) SCNA correlation enrichments. (Right panel) PM correlation enrichments. Dotted lines denote cutoffs corresponding to FDRGSEA < 0.05. (C) iRegulon transcription factor prediction of top 200 genes correlating with SCNA (left) or PM (right) burden. Per tumor type (rows), transcription factors (columns) predicted to regulate a significant number (number within tile) are shown. In cases where a transcription factor is predicted, the correlation coefficient of that factor's gene itself is denoted by the color (see legend).


